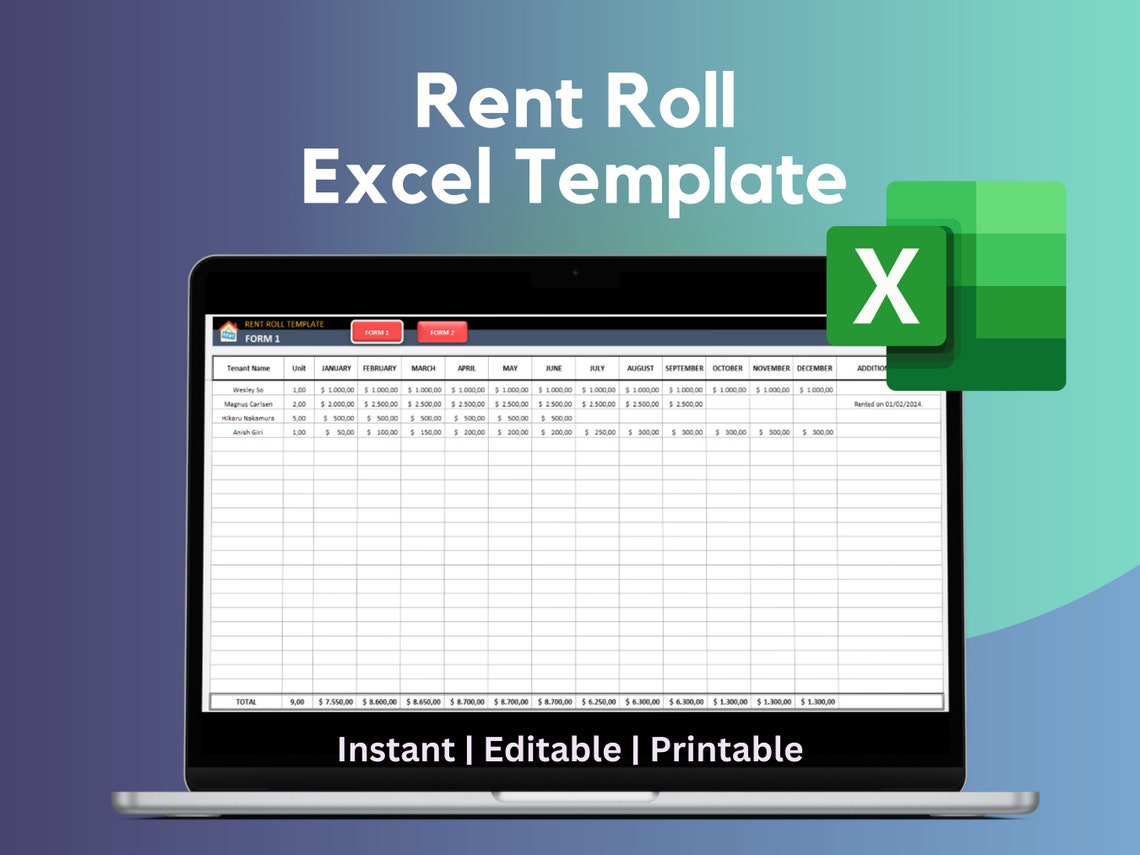
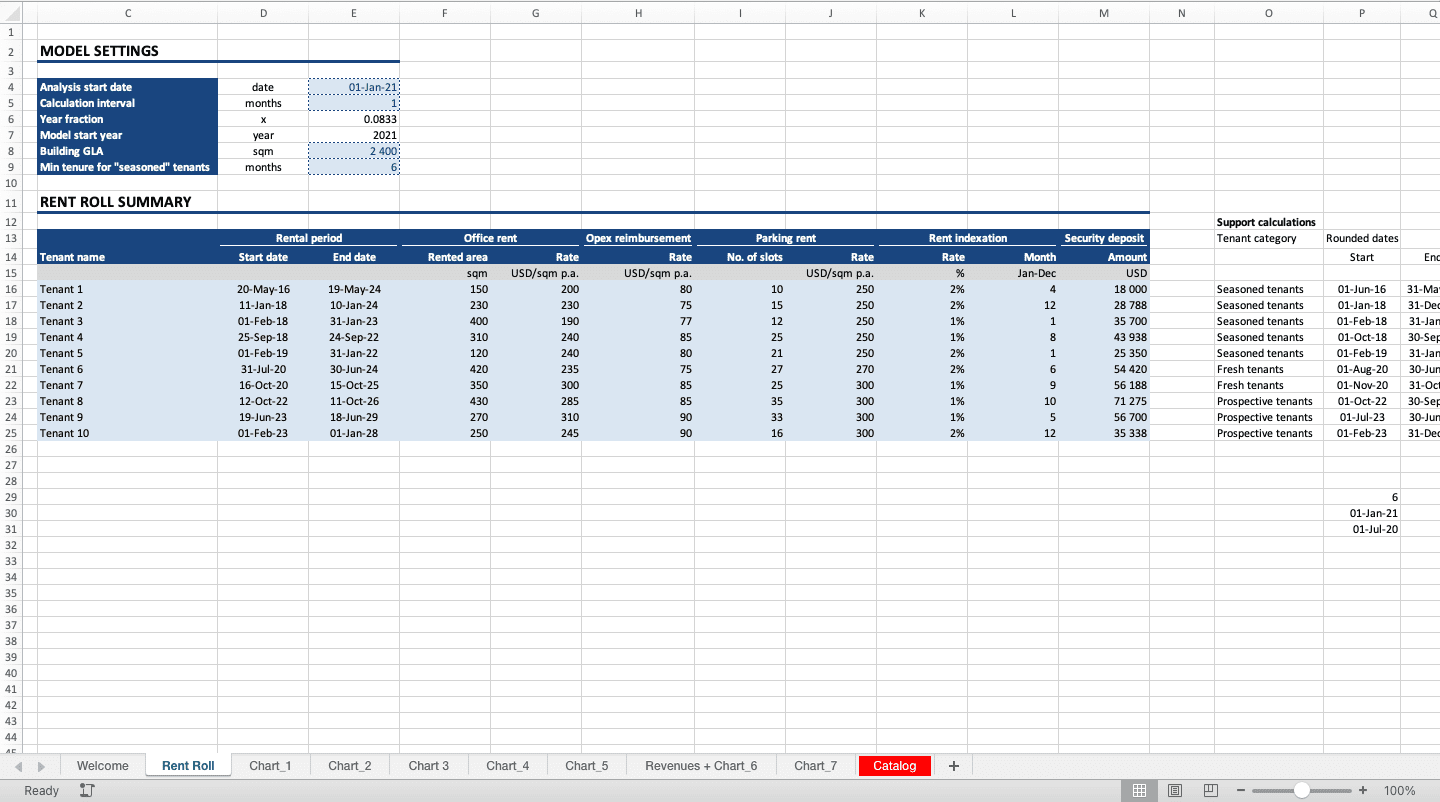
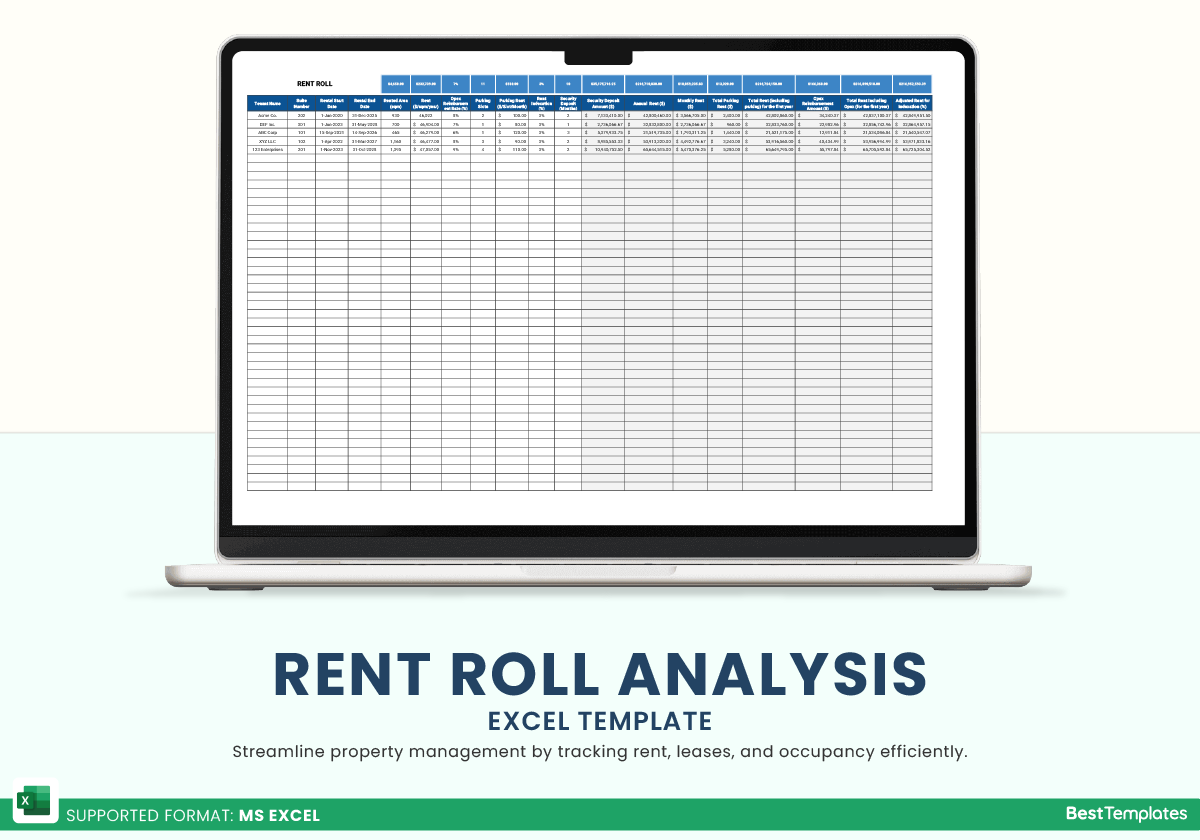
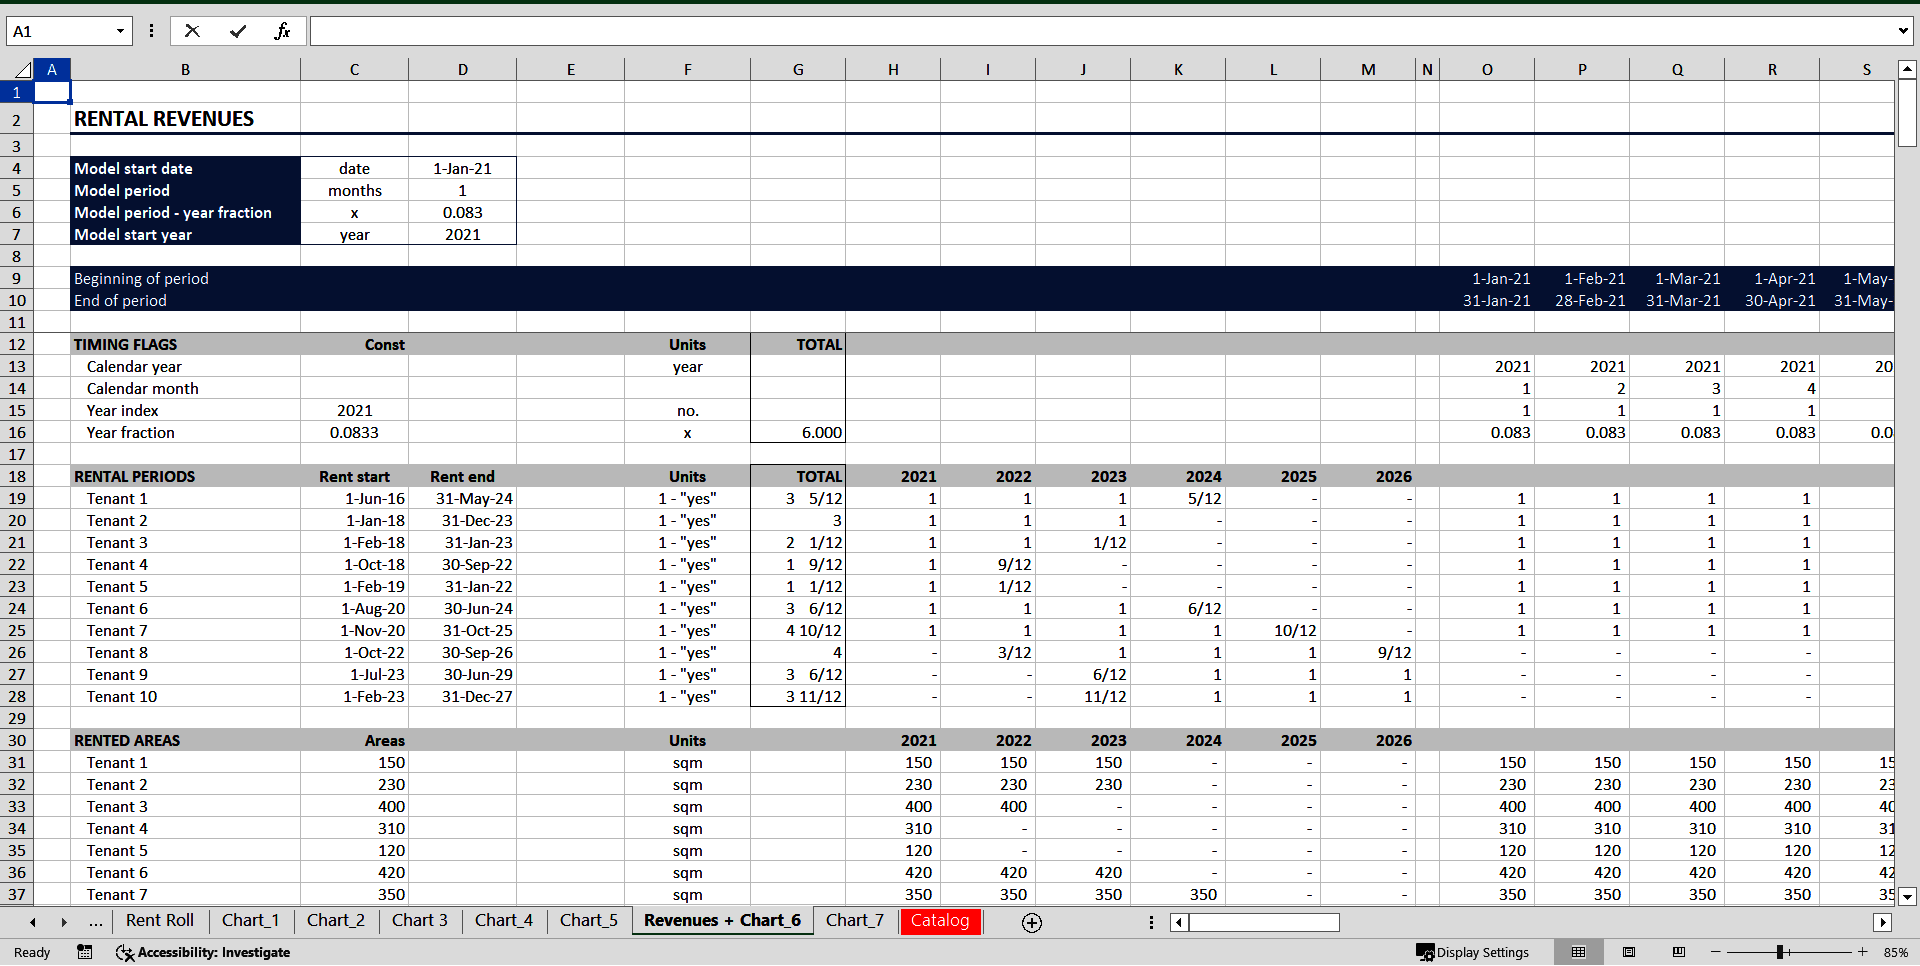
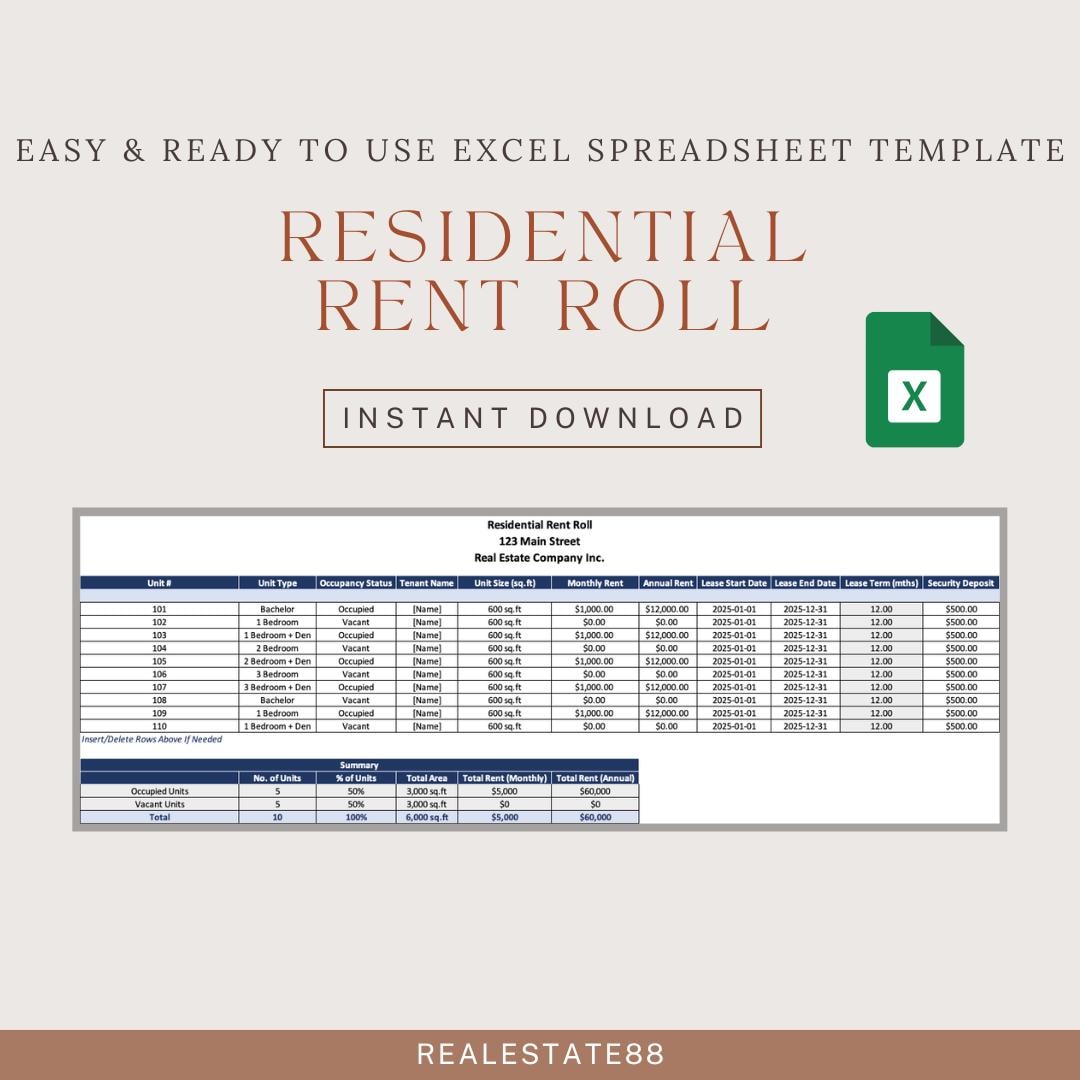
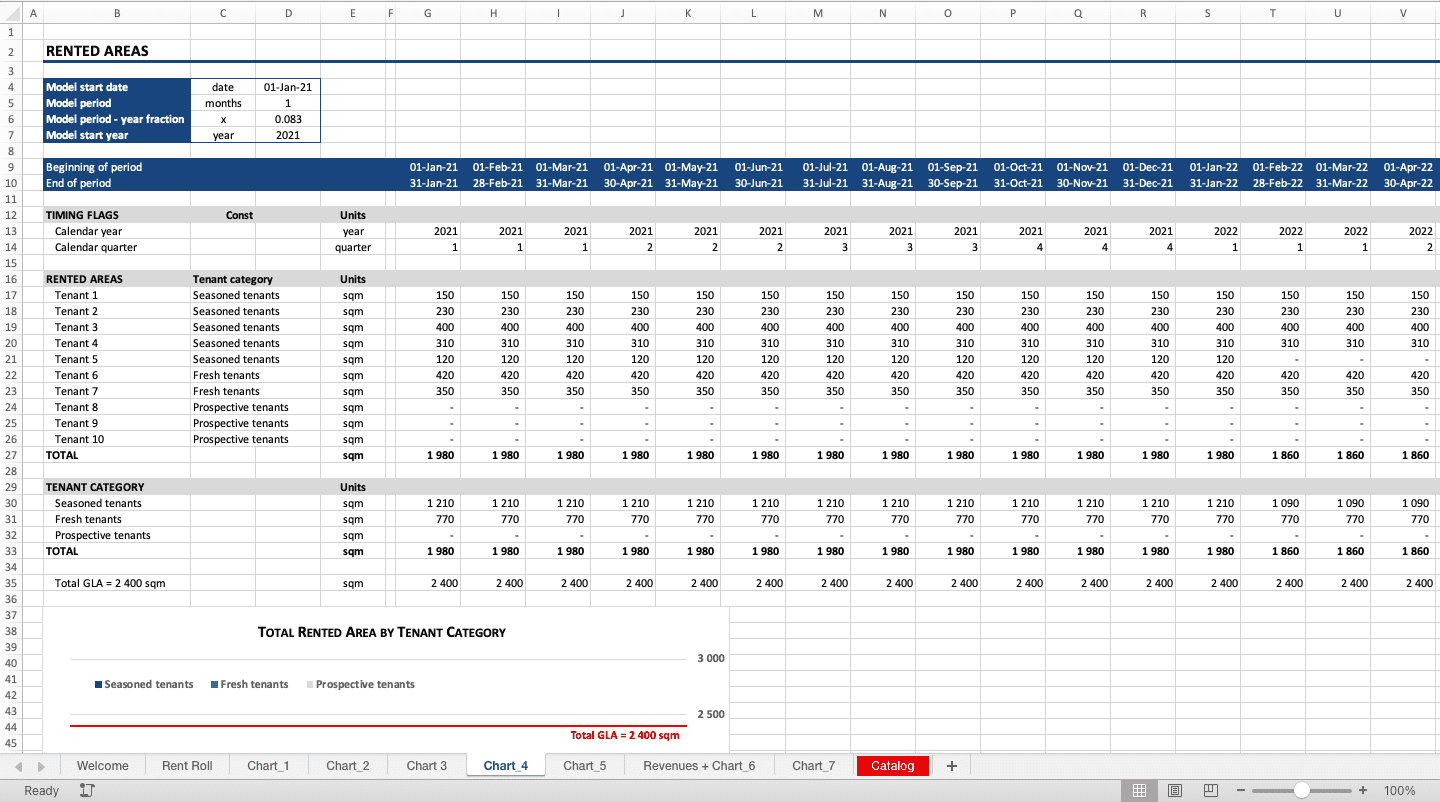
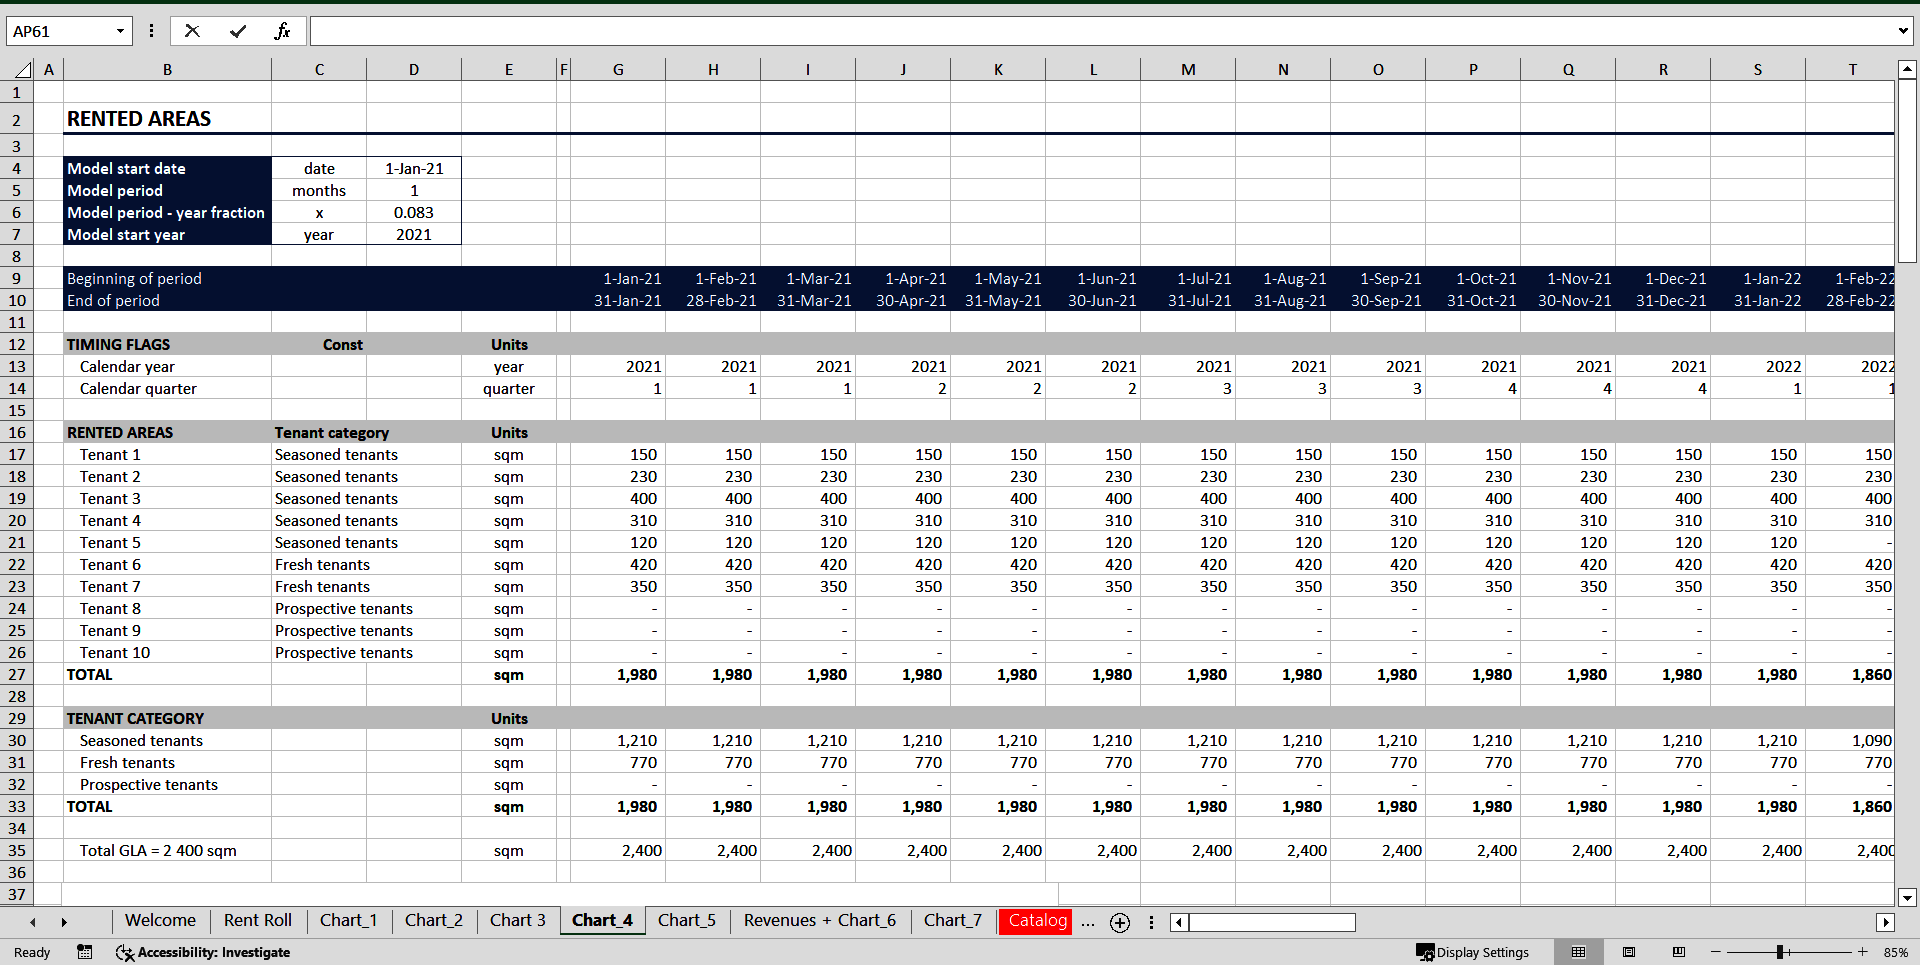
Rent Roll Analysis Template Excel is the unsung hero behind every successful multi‑unit property investment. It’s not just a spreadsheet; it’s a living, breathing dashboard that turns raw data into actionable insight, letting you spot trends, negotiate better lease terms, and forecast future cash flow with confidence.
Why a Dedicated Rent Roll Template Matters
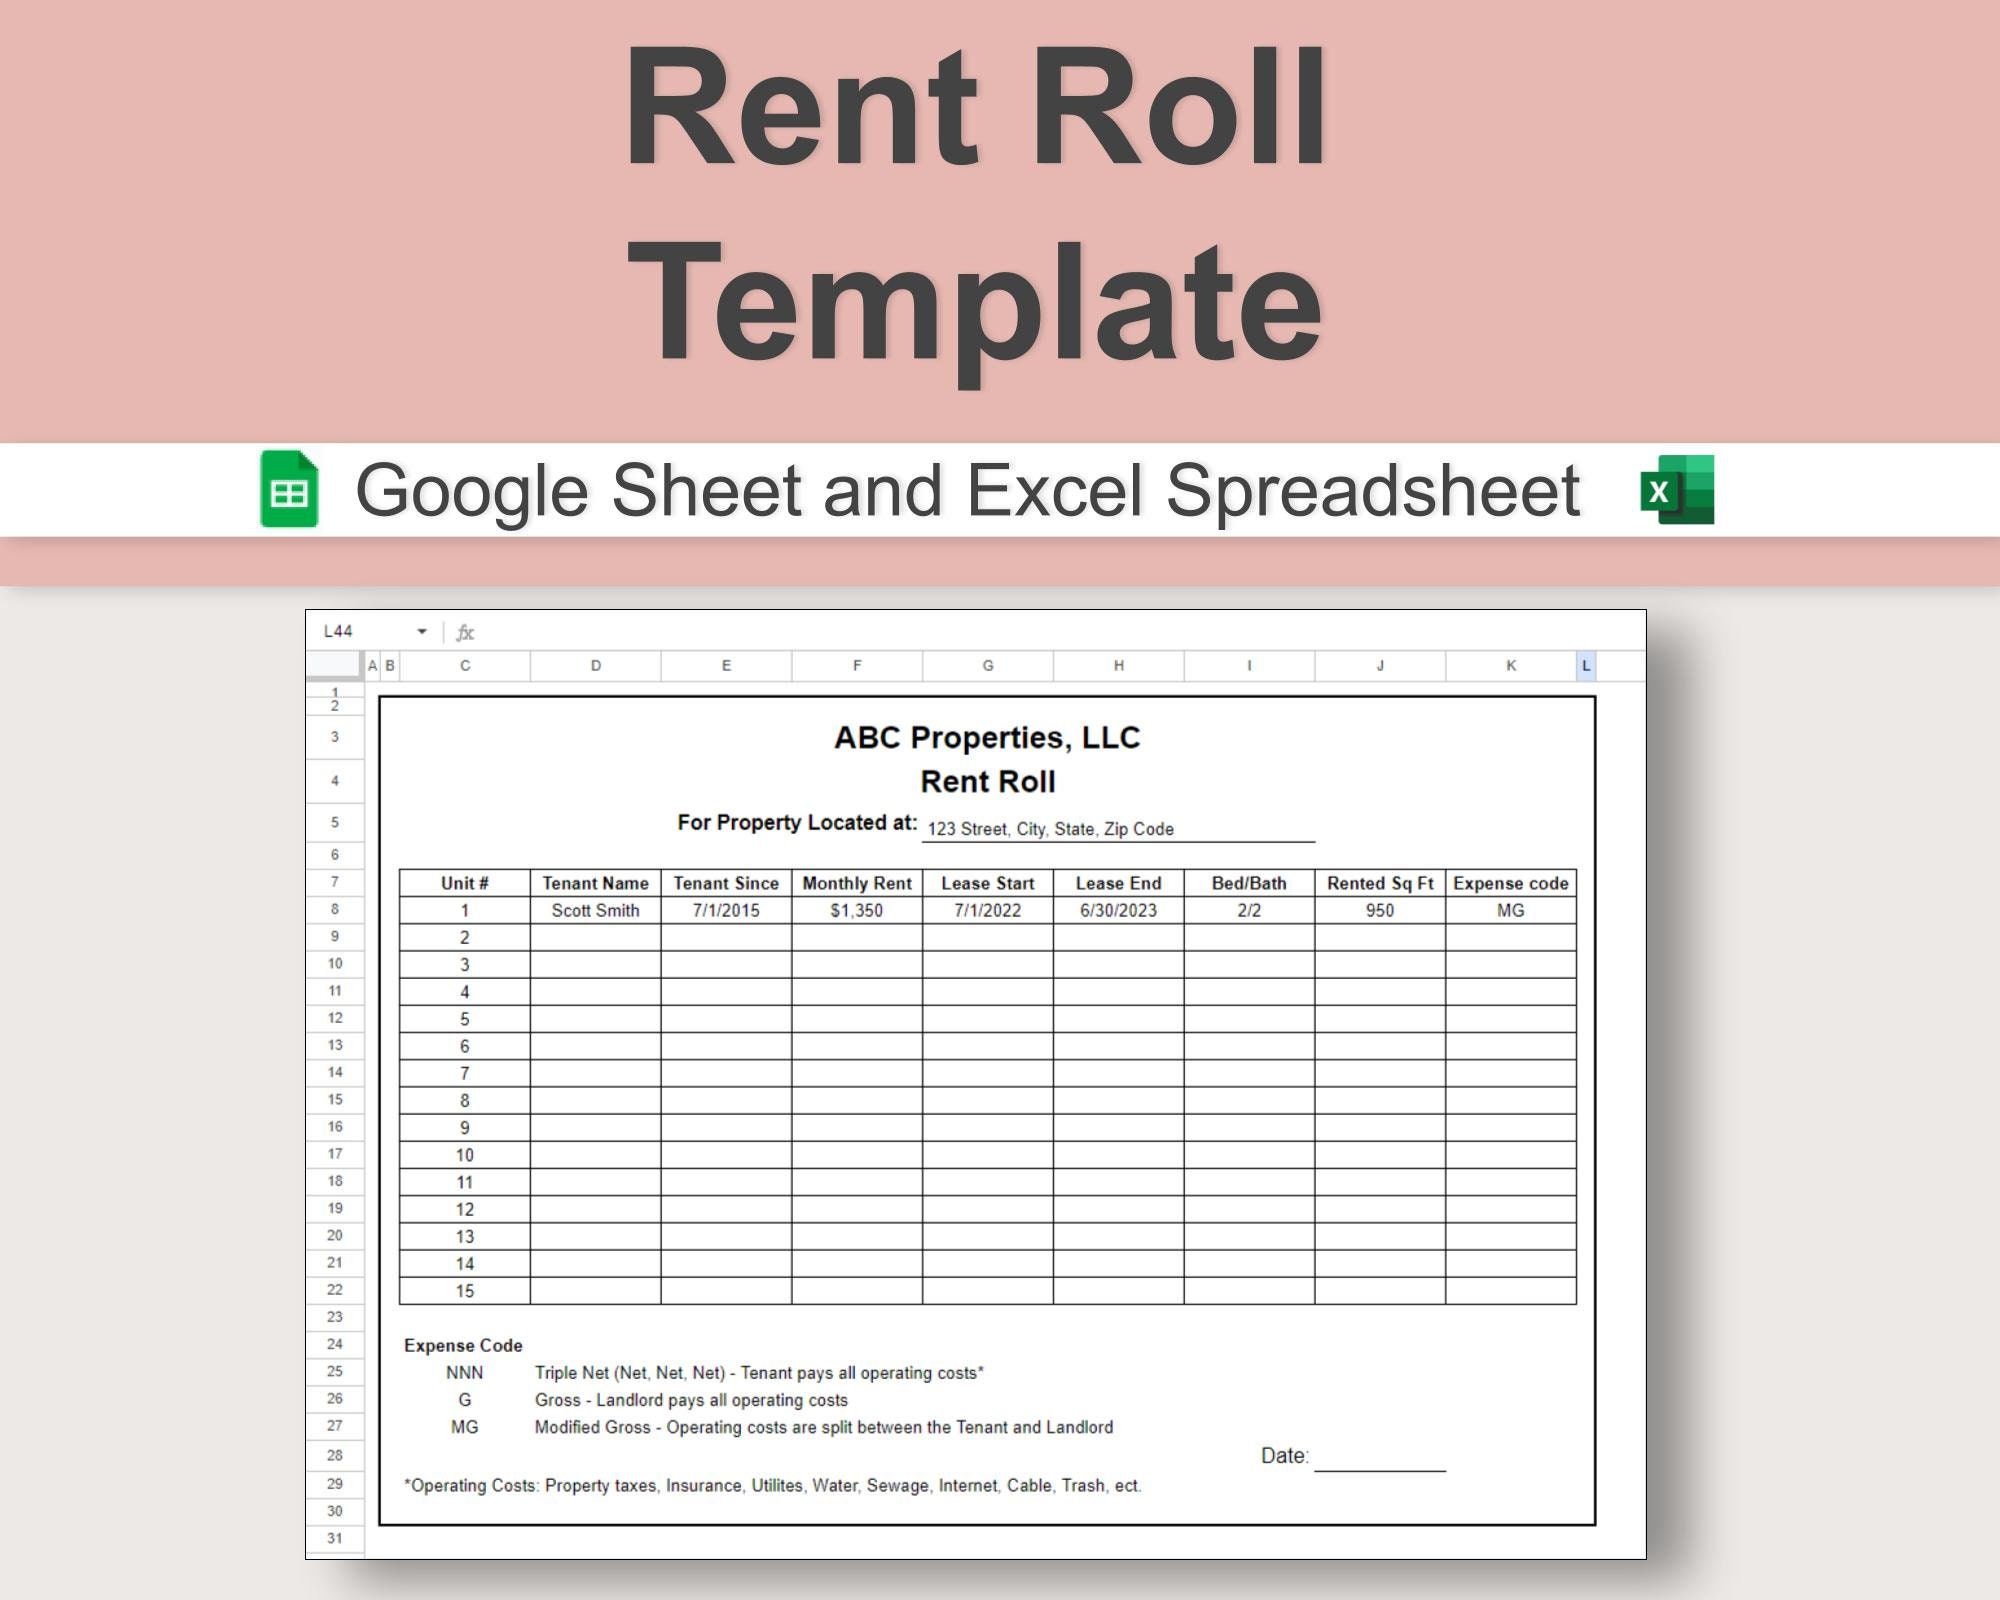
When you first acquire a building, you’re flooded with numbers: monthly rents, lease dates, tenant names, and more. A generic spreadsheet quickly becomes unwieldy, and mistakes can cost thousands of dollars. A dedicated Rent Roll Analysis Template Excel forces structure, reduces manual errors, and provides a single source of truth for your portfolio.
- Consistency: Every property follows the same format, making comparative analysis effortless.
- Speed: Pre‑built formulas and pivot tables mean you can generate reports in minutes, not hours.
- Accuracy: Built‑in checks flag missing data, out‑of‑range values, or duplicate tenant entries.
- Scalability: Whether you own one duplex or a 200‑unit apartment complex, the same template scales.
Core Components of an Effective Template
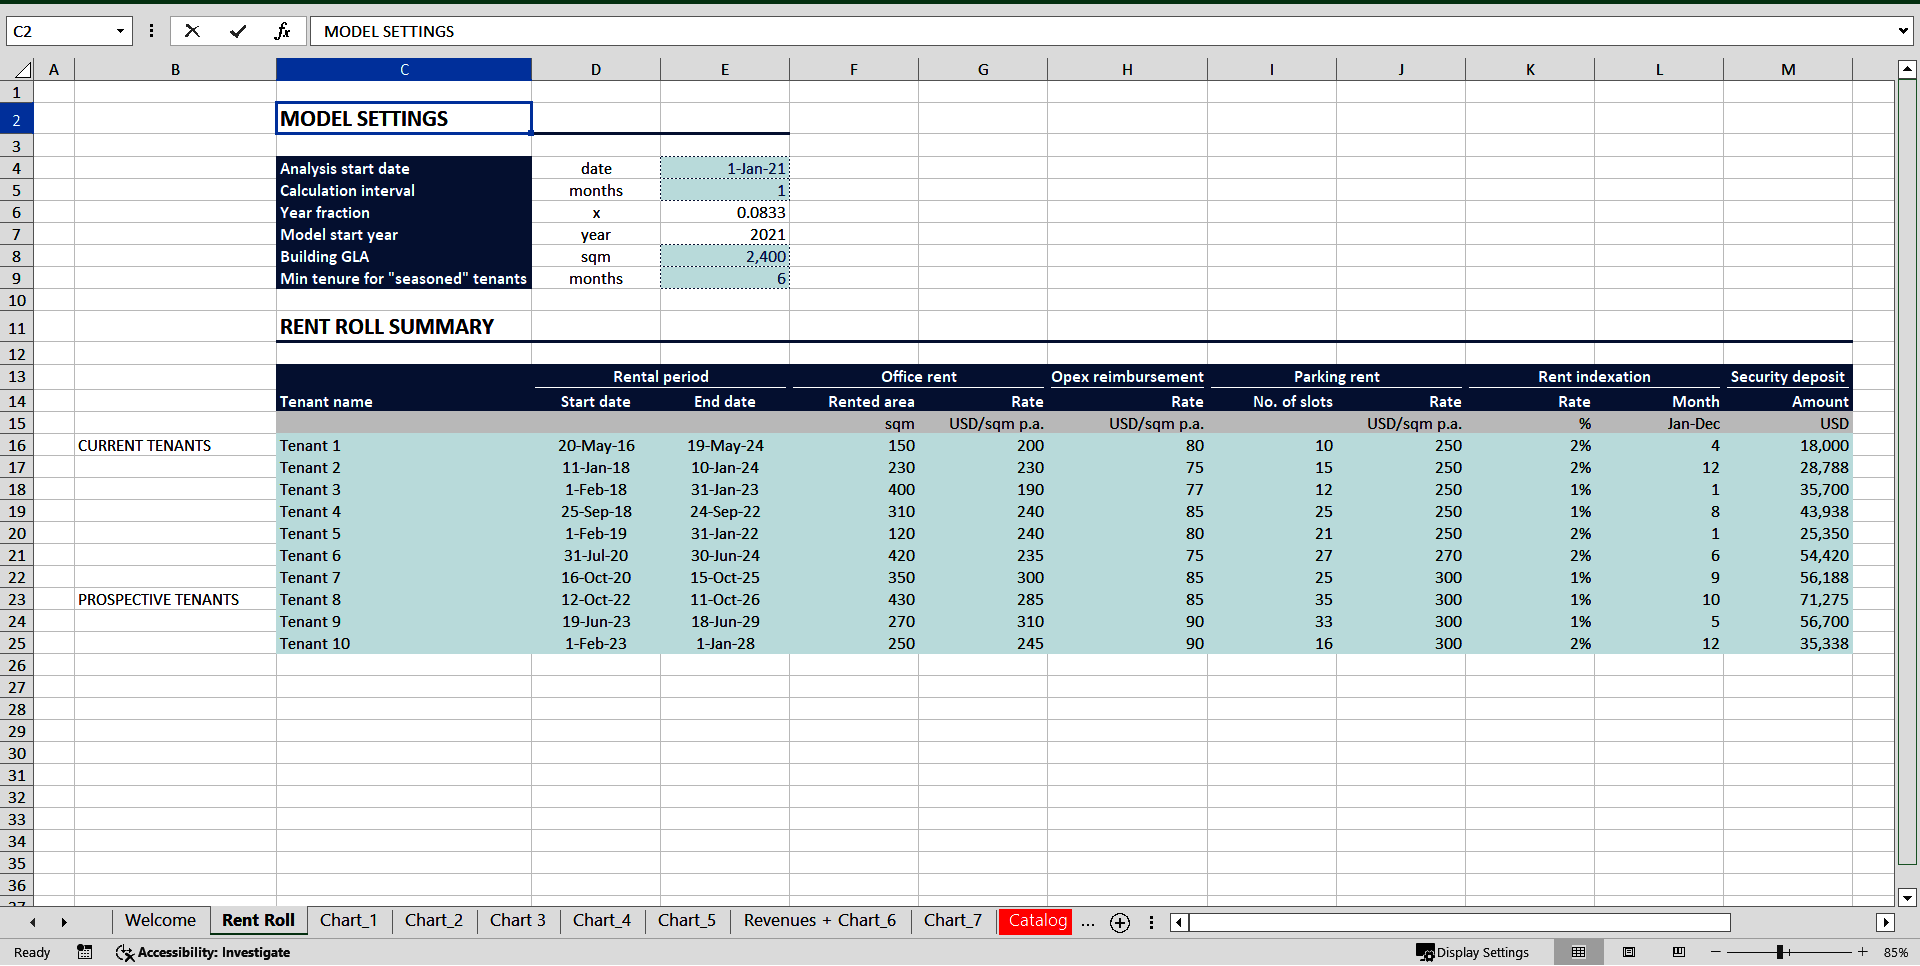
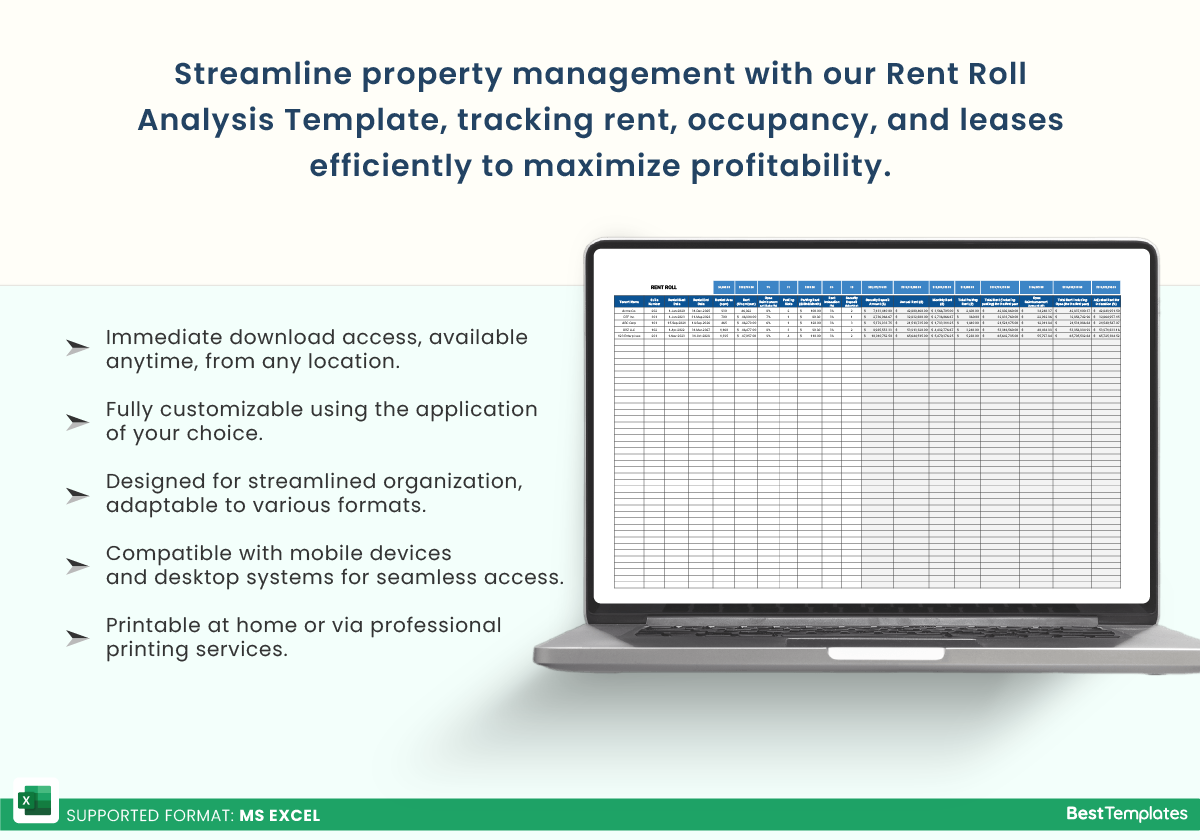
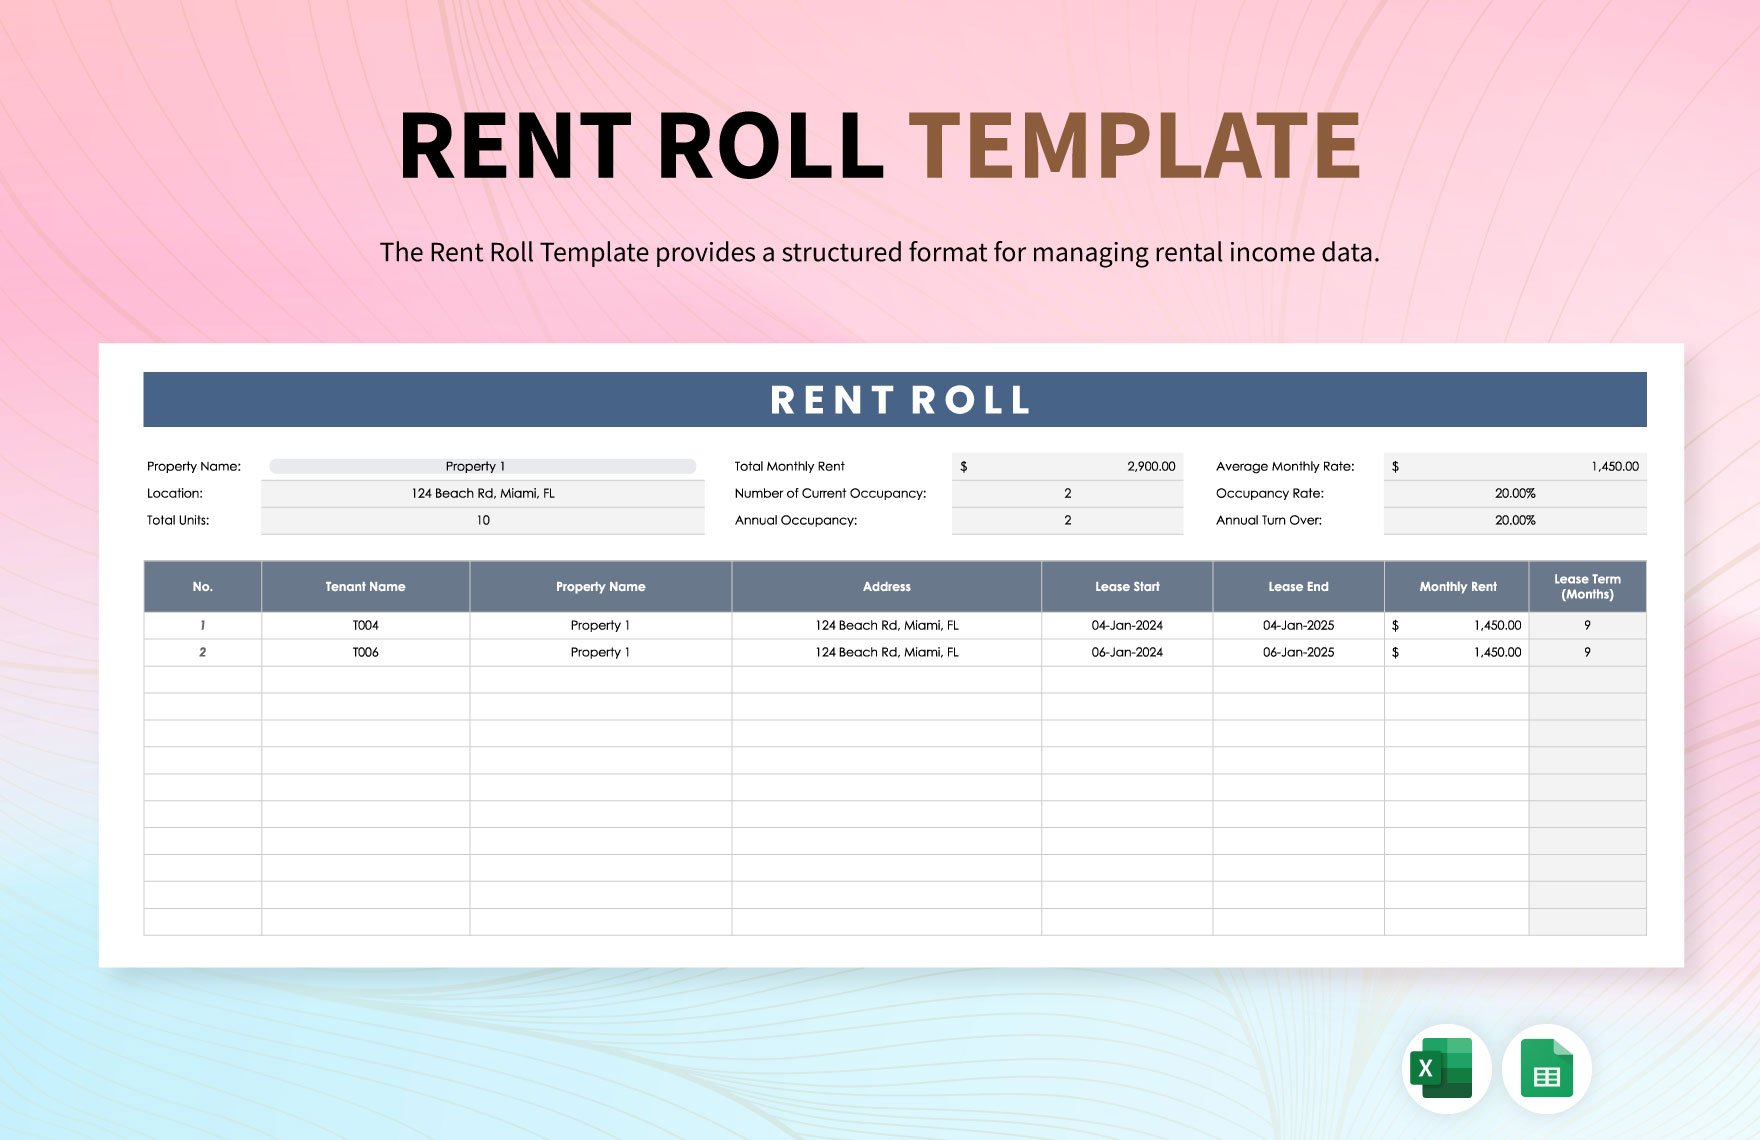
Tenant Master Sheet
This is the heart of your rent roll. Include columns for:
- Unit Number
- Tenant Name
- Lease Start Date
- Lease End Date
- Monthly Rent
- Security Deposit
- Rent Escalation Clause
- Renewal Options
- Rent Paid to Date
- Vacancy Status
By maintaining a single master sheet, you avoid duplicate entries and ensure every calculation pulls from the same source.
Lease Summary Dashboard
Use a pivot table to transform the master sheet into an instant snapshot:
- Occupancy Rate (%)
- Total Gross Potential Rent
- Effective Rent (after concessions)
- Average Lease Length
- Upcoming Lease Expirations
- Renewal Opportunities
Adding slicers lets you filter by unit type, building, or tenant status, making the dashboard interactive for managers on the go.
Cash Flow Forecast
Combine the lease summary with projected rent increases, vacancy assumptions, and operating costs to build a 5‑year cash flow model. Use Excel’s =FV() and =PV() functions to calculate the present value of future earnings.
Risk Assessment Matrix
Assign risk scores to tenants based on credit history, lease age, and payment punctuality. A conditional formatting rule can turn cells green for low risk, yellow for medium, and red for high. This visual cue helps prioritize follow‑ups.
Building the Template from Scratch
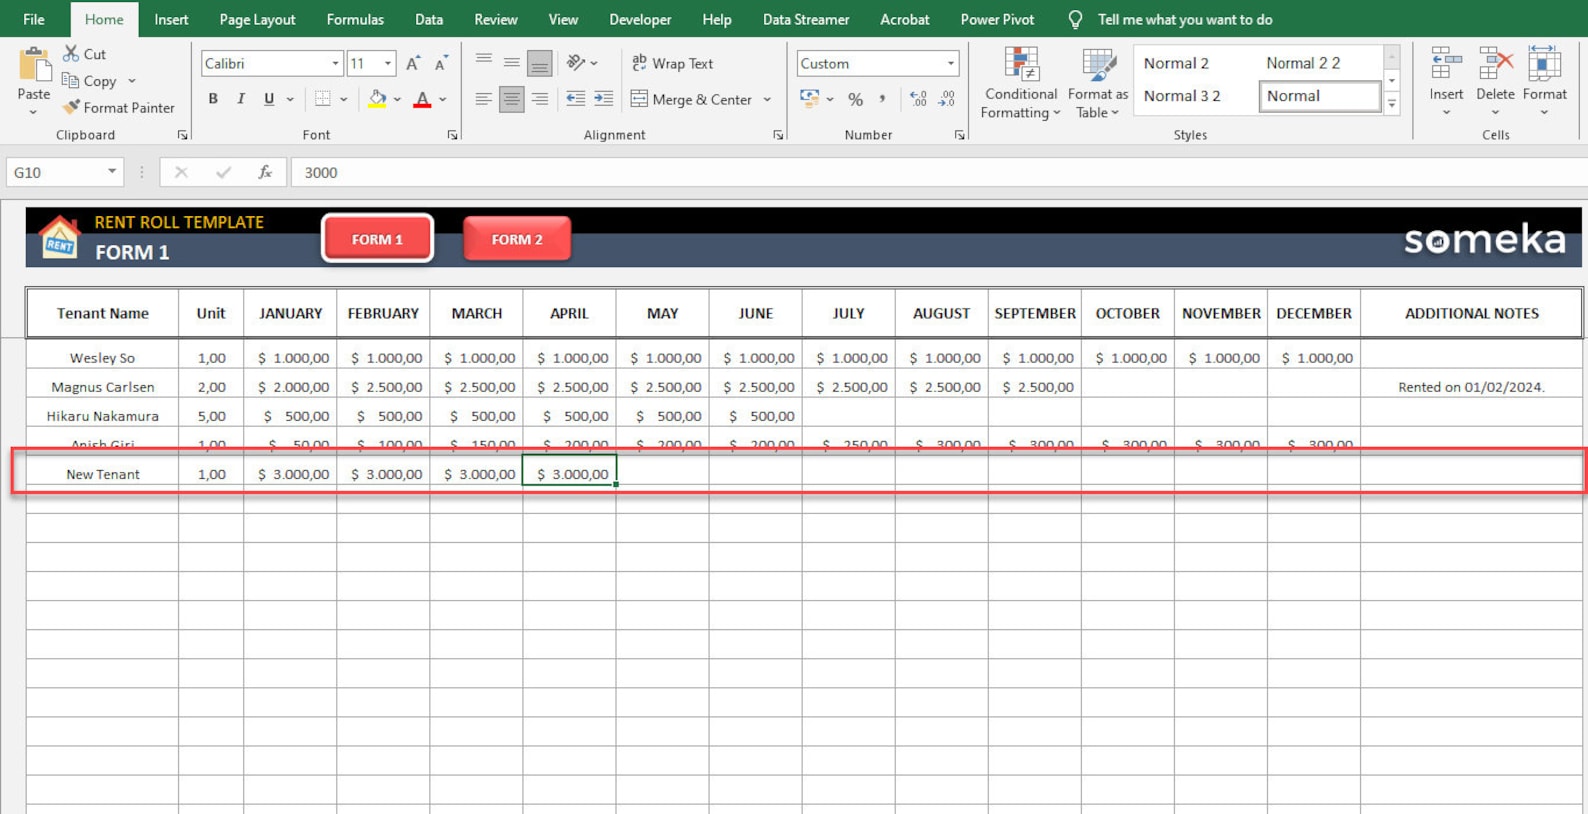
Step 1: Set Up the Master Sheet
Open a new workbook, rename the first sheet to “Tenants.” Create a header row with bold text and freeze the pane so you can scroll through long lists.
Step 2: Define Data Validation Rules
To keep data clean:
- Use Data Validation for dates to ensure they are real calendar dates.
- Restrict rent amounts to numeric values between a realistic range (e.g., $300–$5,000).
- Set up a drop‑down for “Vacancy Status” with options like “Occupied,” “Vacant,” “Leasing.”
Step 3: Create Calculated Fields
Add columns for:
- Months Remaining =
=DATEDIF(TODAY(), Lease End Date, "m") - Annualized Rent =
=Monthly Rent * 12 - Concession % =
=(Rent Paid to Date / (Monthly Rent * Months Remaining)) - 1
These formulas feed directly into the dashboard.
Step 4: Build the Pivot Dashboard
Create a new sheet named “Dashboard.” Insert a pivot table from the Tenants sheet:
- Drag Unit Number to Rows.
- Drag Monthly Rent and Annualized Rent to Values (set to Sum).
- Drag Vacancy Status to Filters.
Add slicers for Lease Start and End dates so you can view performance over a specific period.
Step 5: Apply Conditional Formatting
Highlight critical data:
- Red fill for vacancies over 90 days.
- Yellow for leases expiring within 3 months.
- Green for renewals with a positive escalation clause.
These visual cues turn raw numbers into intuitive insights.
Real‑World Example: Turning a Struggling Property Into Profit
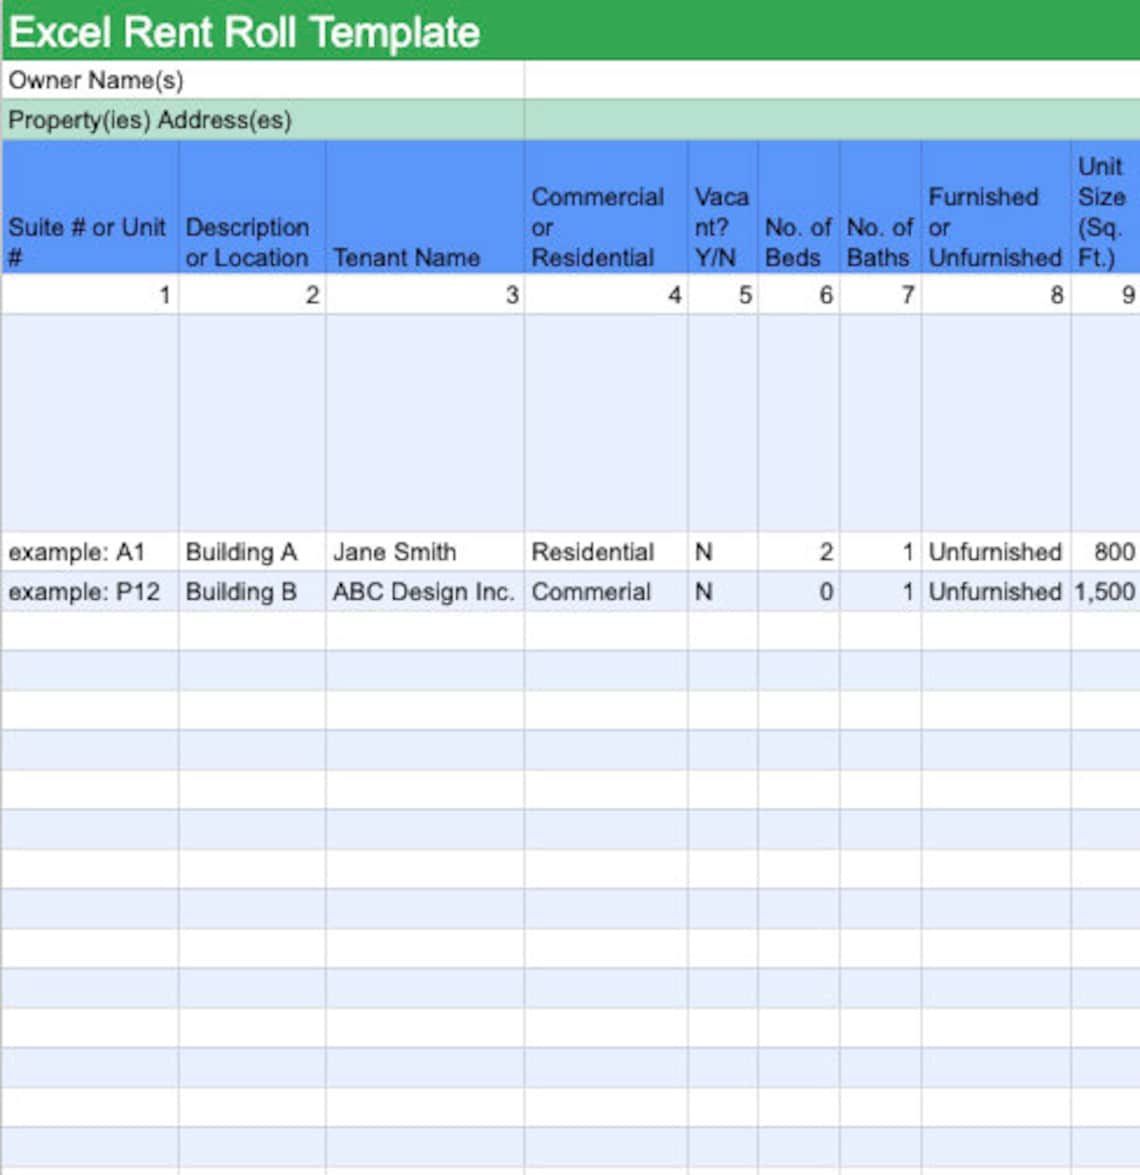
Meet Alex, a property manager who owned a 15‑unit duplex with a 65% occupancy rate and a handful of long‑term, low‑rent tenants. Alex imported the rent roll into a new Rent Roll Analysis Template Excel and discovered:
- Three units had leases due to expire in the next month.
- One tenant had missed two rent payments in the last quarter.
- Average rent was $1,200, but the market rate for similar units was $1,500.
Using the dashboard, Alex identified three units ripe for a rent increase. He negotiated 10% increases for two units, secured a renewal for the expiring lease at a 5% increase, and replaced the delinquent tenant with a credit‑worthy applicant. Within six months, occupancy rose to 85%, and the gross potential rent increased by $4,500 monthly.
Key Takeaways from Alex’s Story
- Leverage the template to spot upcoming lease expirations.
- Use rent escalation clauses to justify increases.
- Track tenant payment behavior to mitigate risk.
Advanced Tips for Power Users
Integrate with Property Management Software
Many PMS platforms export rent rolls as CSV. Importing them directly into the master sheet keeps the template up‑to‑date without manual entry.
Use VBA to Automate Alerts
Write a simple macro that runs on workbook open, checking for leases expiring within 30 days and generating a pop‑up reminder.
Pivot Charts for Visual Storytelling
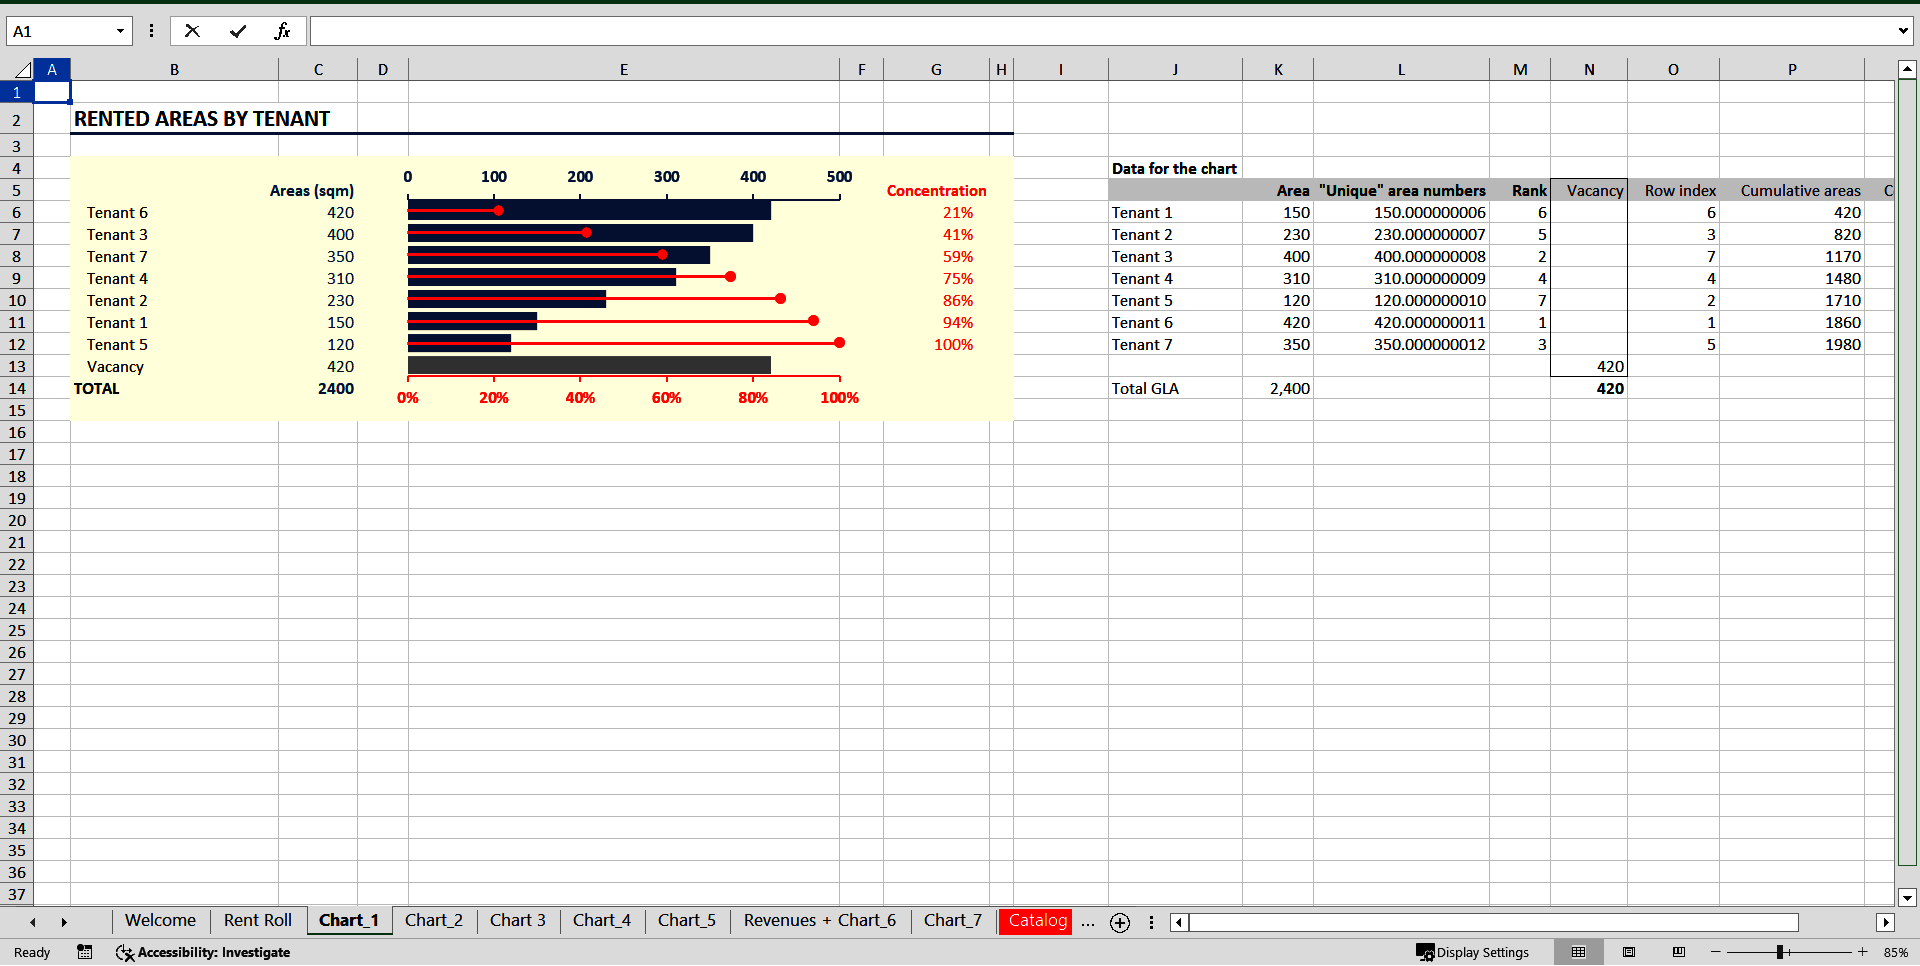
Create bar charts for rent distribution, line charts for vacancy trends, and pie charts for unit type composition. Embedding these in the dashboard makes the report presentable to investors.
Export to PDF for Stakeholders
Set up a button that runs ActiveSheet.ExportAsFixedFormat Type:=xlTypePDF, Filename:="Rent_Roll_Report.pdf". This automates the distribution of a polished PDF to board members or lenders.
Common Mistakes to Avoid
- Inconsistent Units: Always standardize rent amounts to the same currency and measurement (e.g., monthly).
- Manual Data Entry: Even a single typo can skew occupancy calculations. Use drop‑downs and validation.
- Neglecting Security Deposits in cash flow: include them as separate line items.
- Failing to update Lease Expiry Dates after renewals.
Conclusion: Turning Data Into Dollars
Mastering a Rent Roll Analysis Template Excel gives you a strategic edge. It transforms scattered tenant data into a crystal‑clear view of your property’s performance, risk profile, and growth potential. By following the step‑by‑step construction guide, adding advanced automation, and learning from real‑world scenarios like Alex’s, you can move from reactive management to proactive optimization. The result? Higher occupancy, stronger cash flow, and a portfolio that stands out to investors and lenders alike.