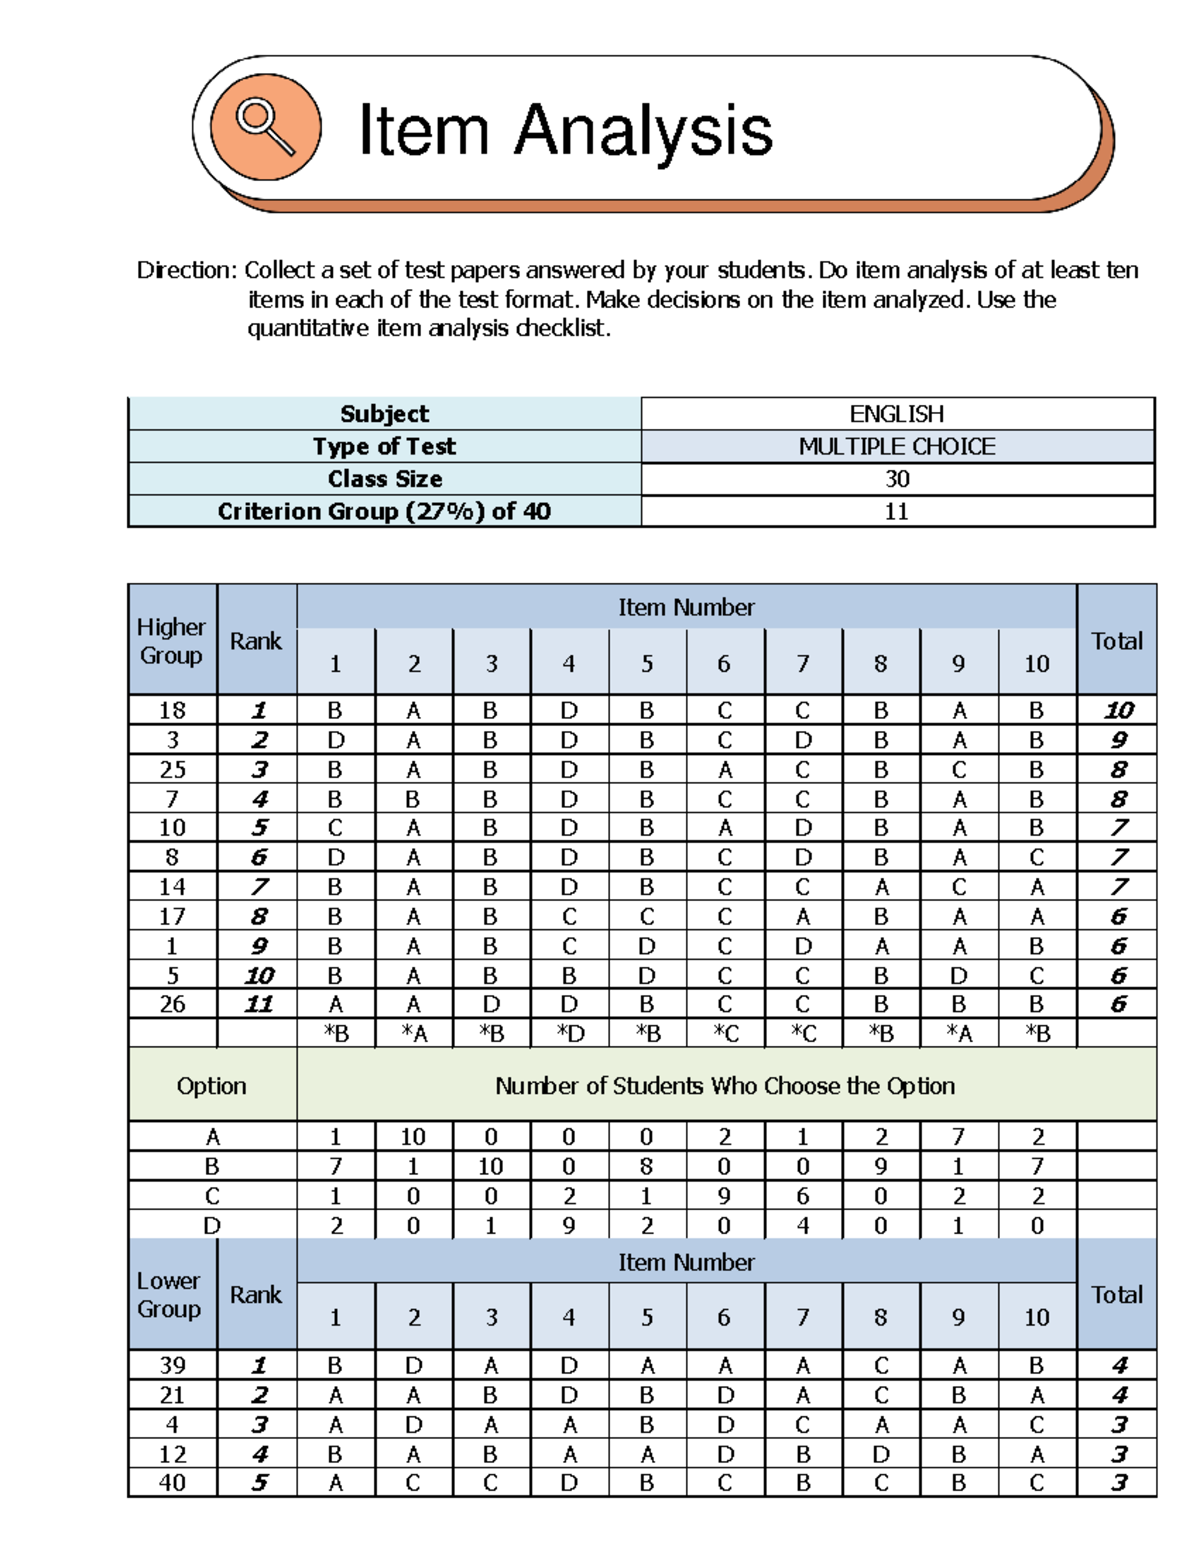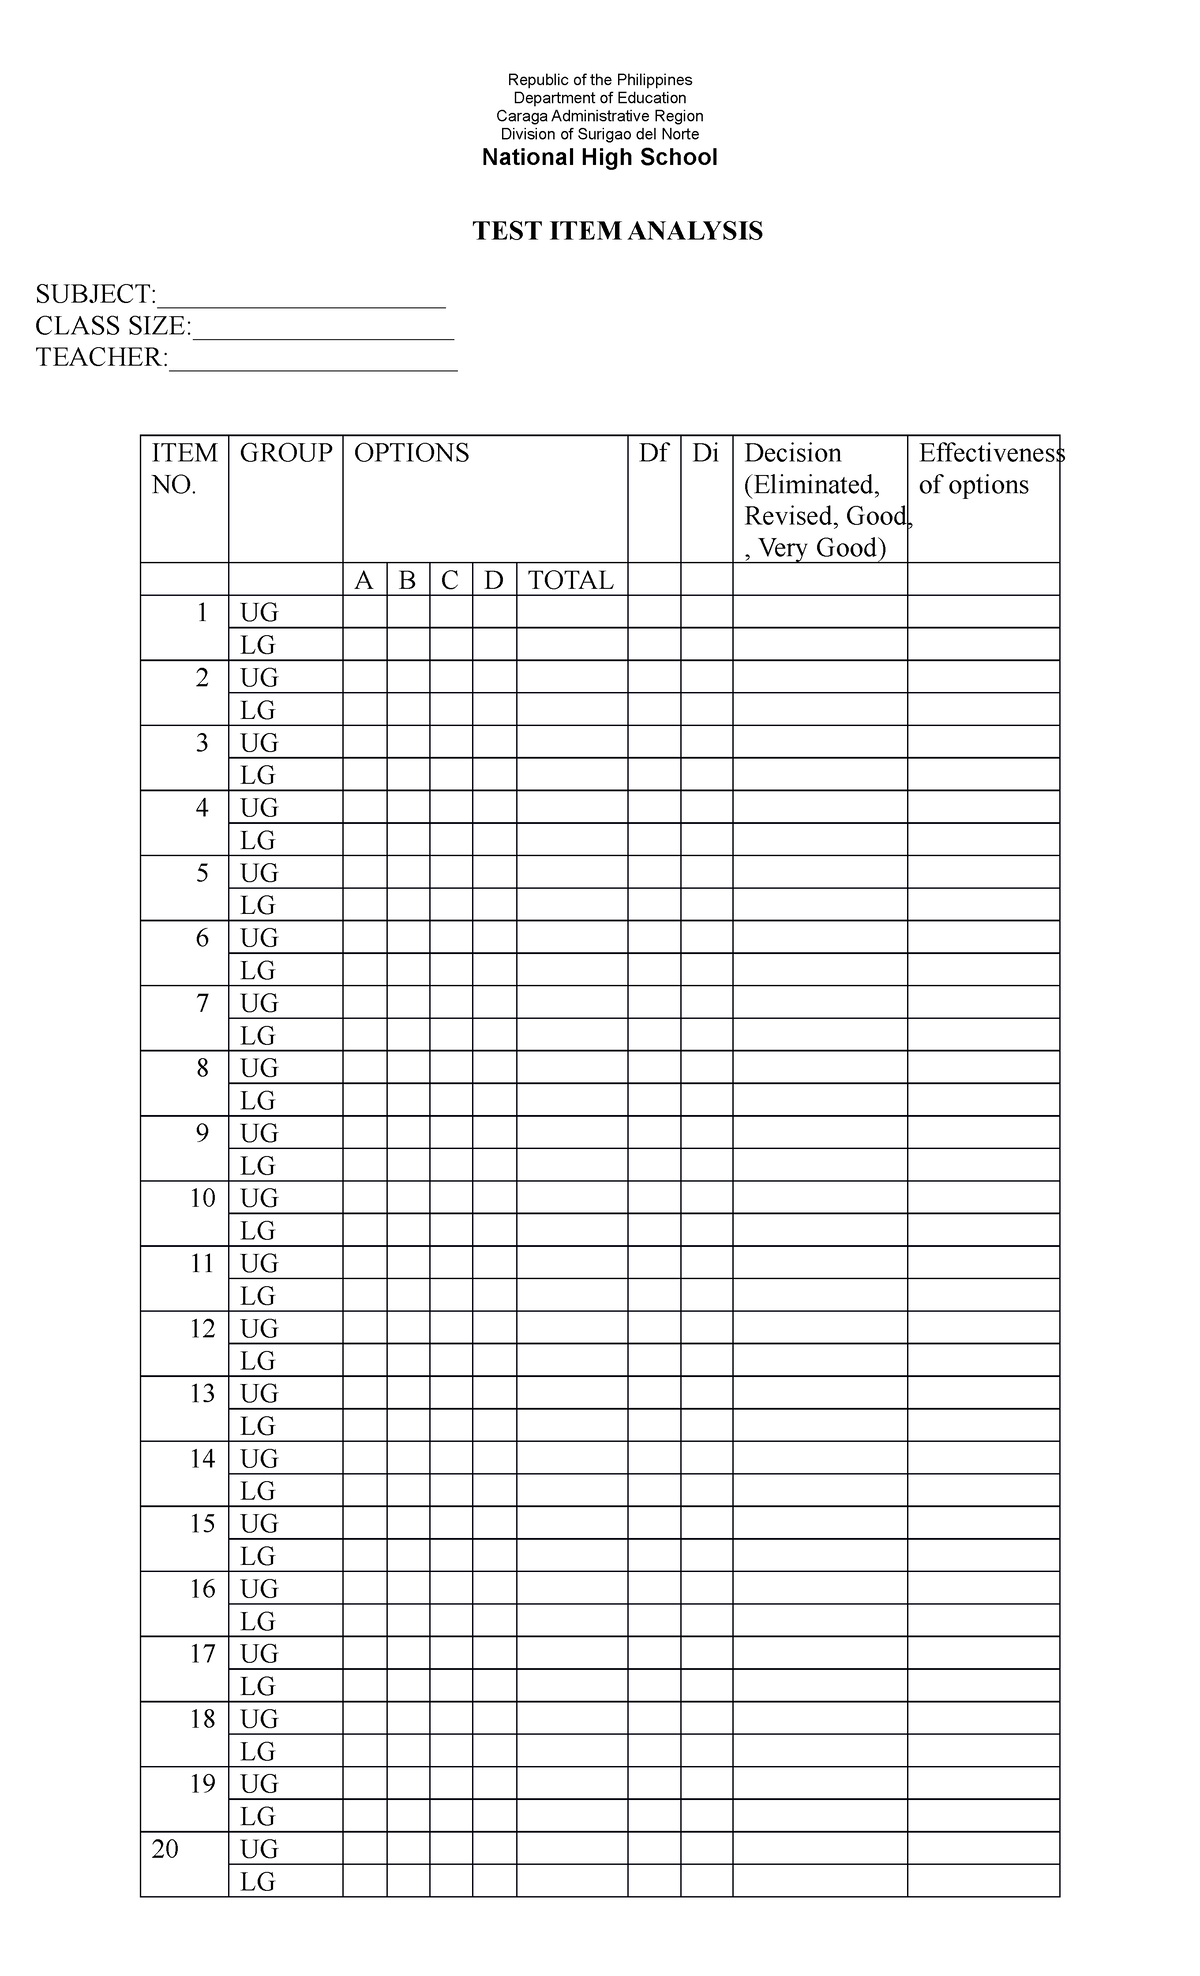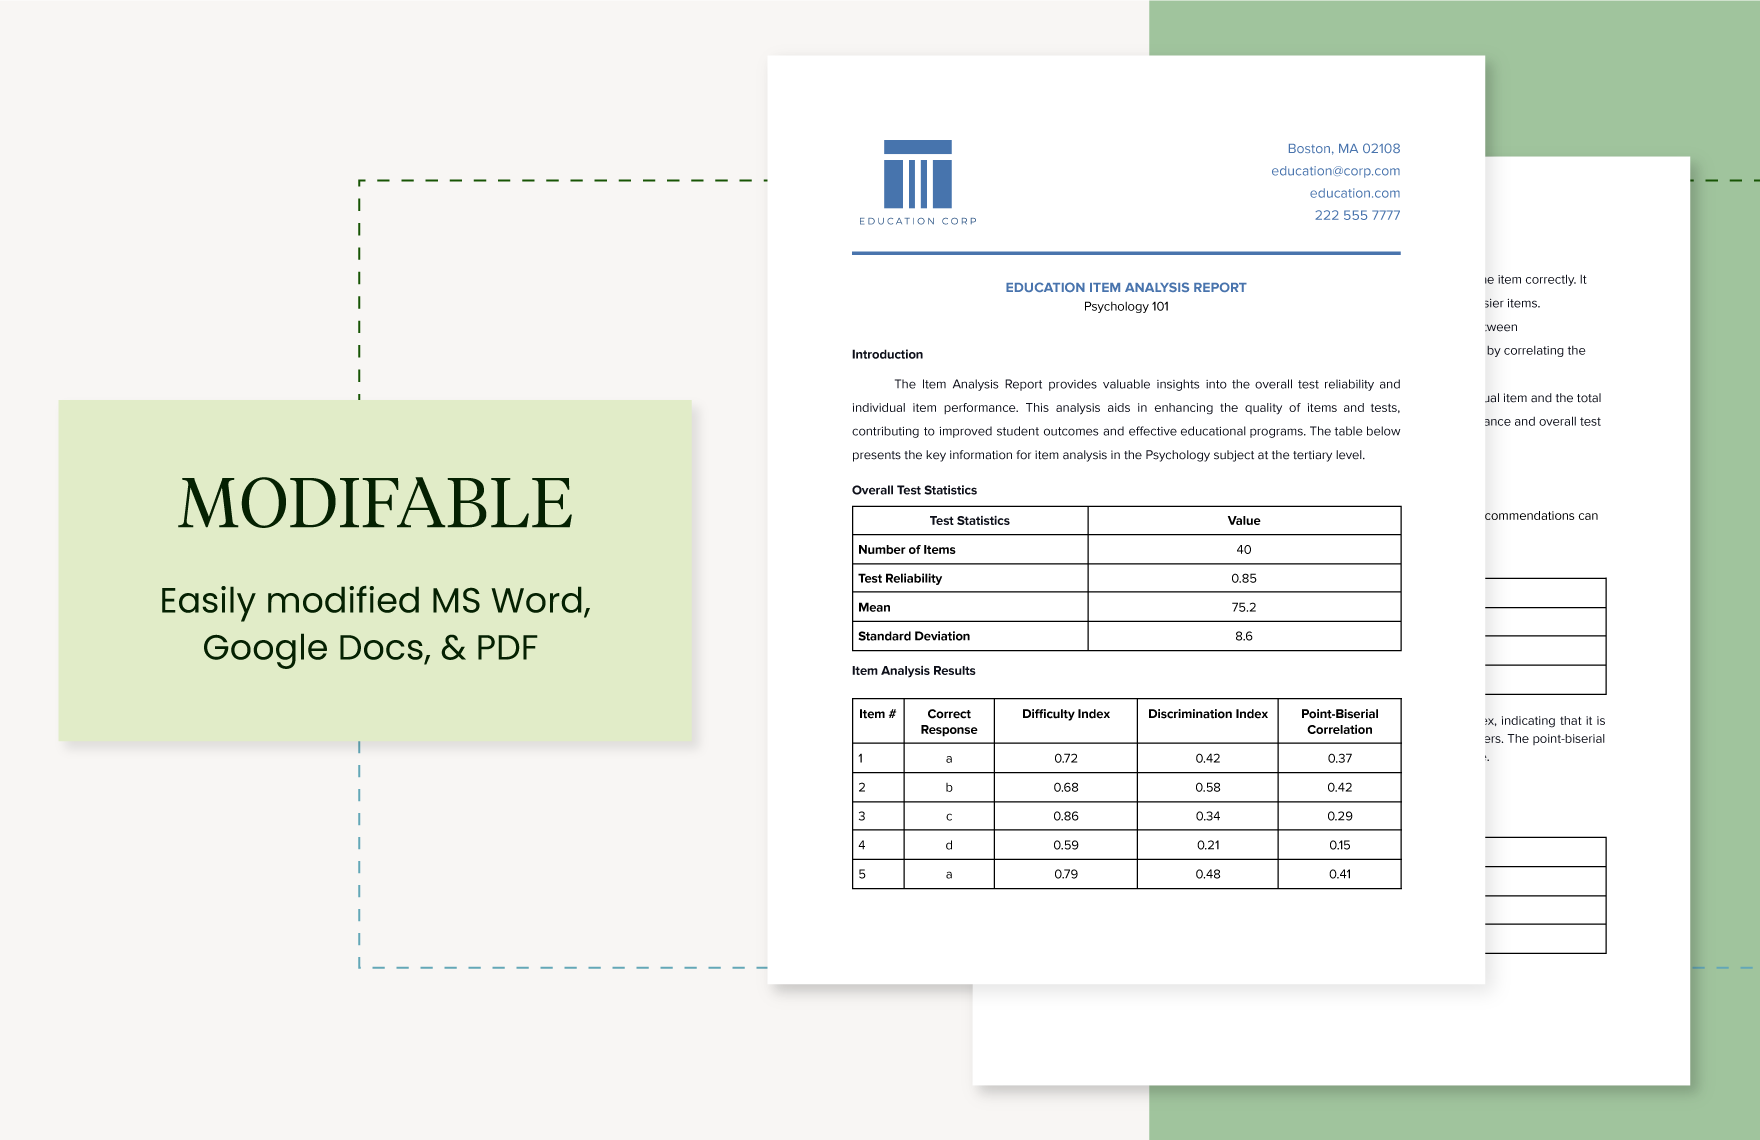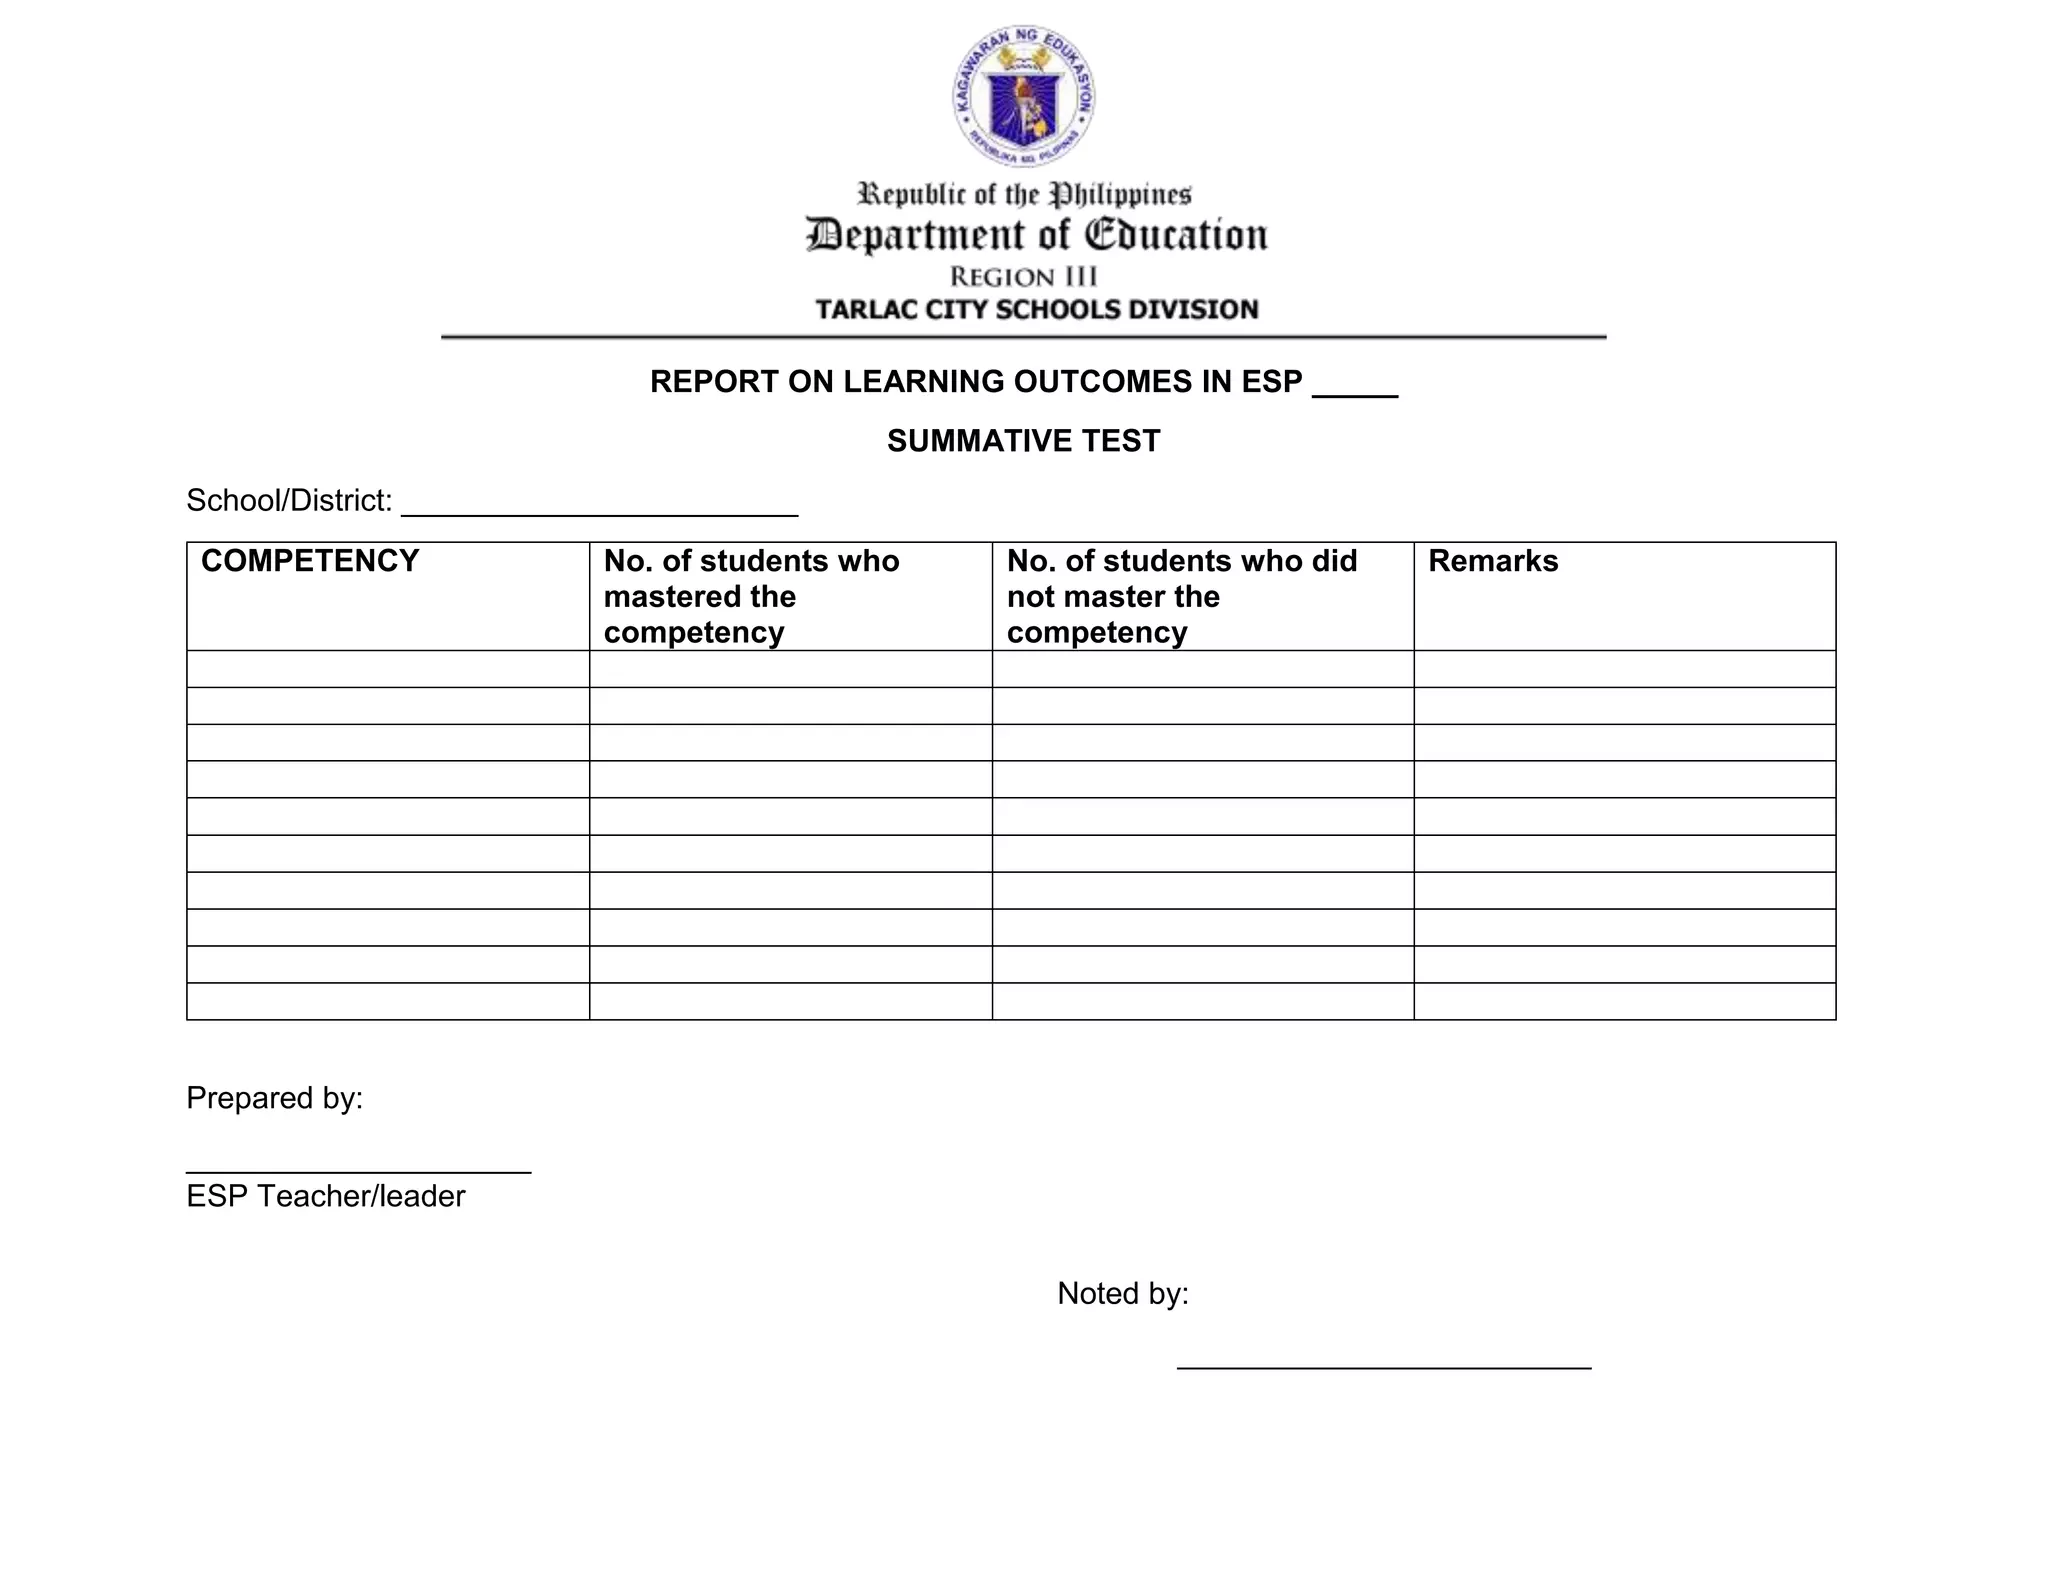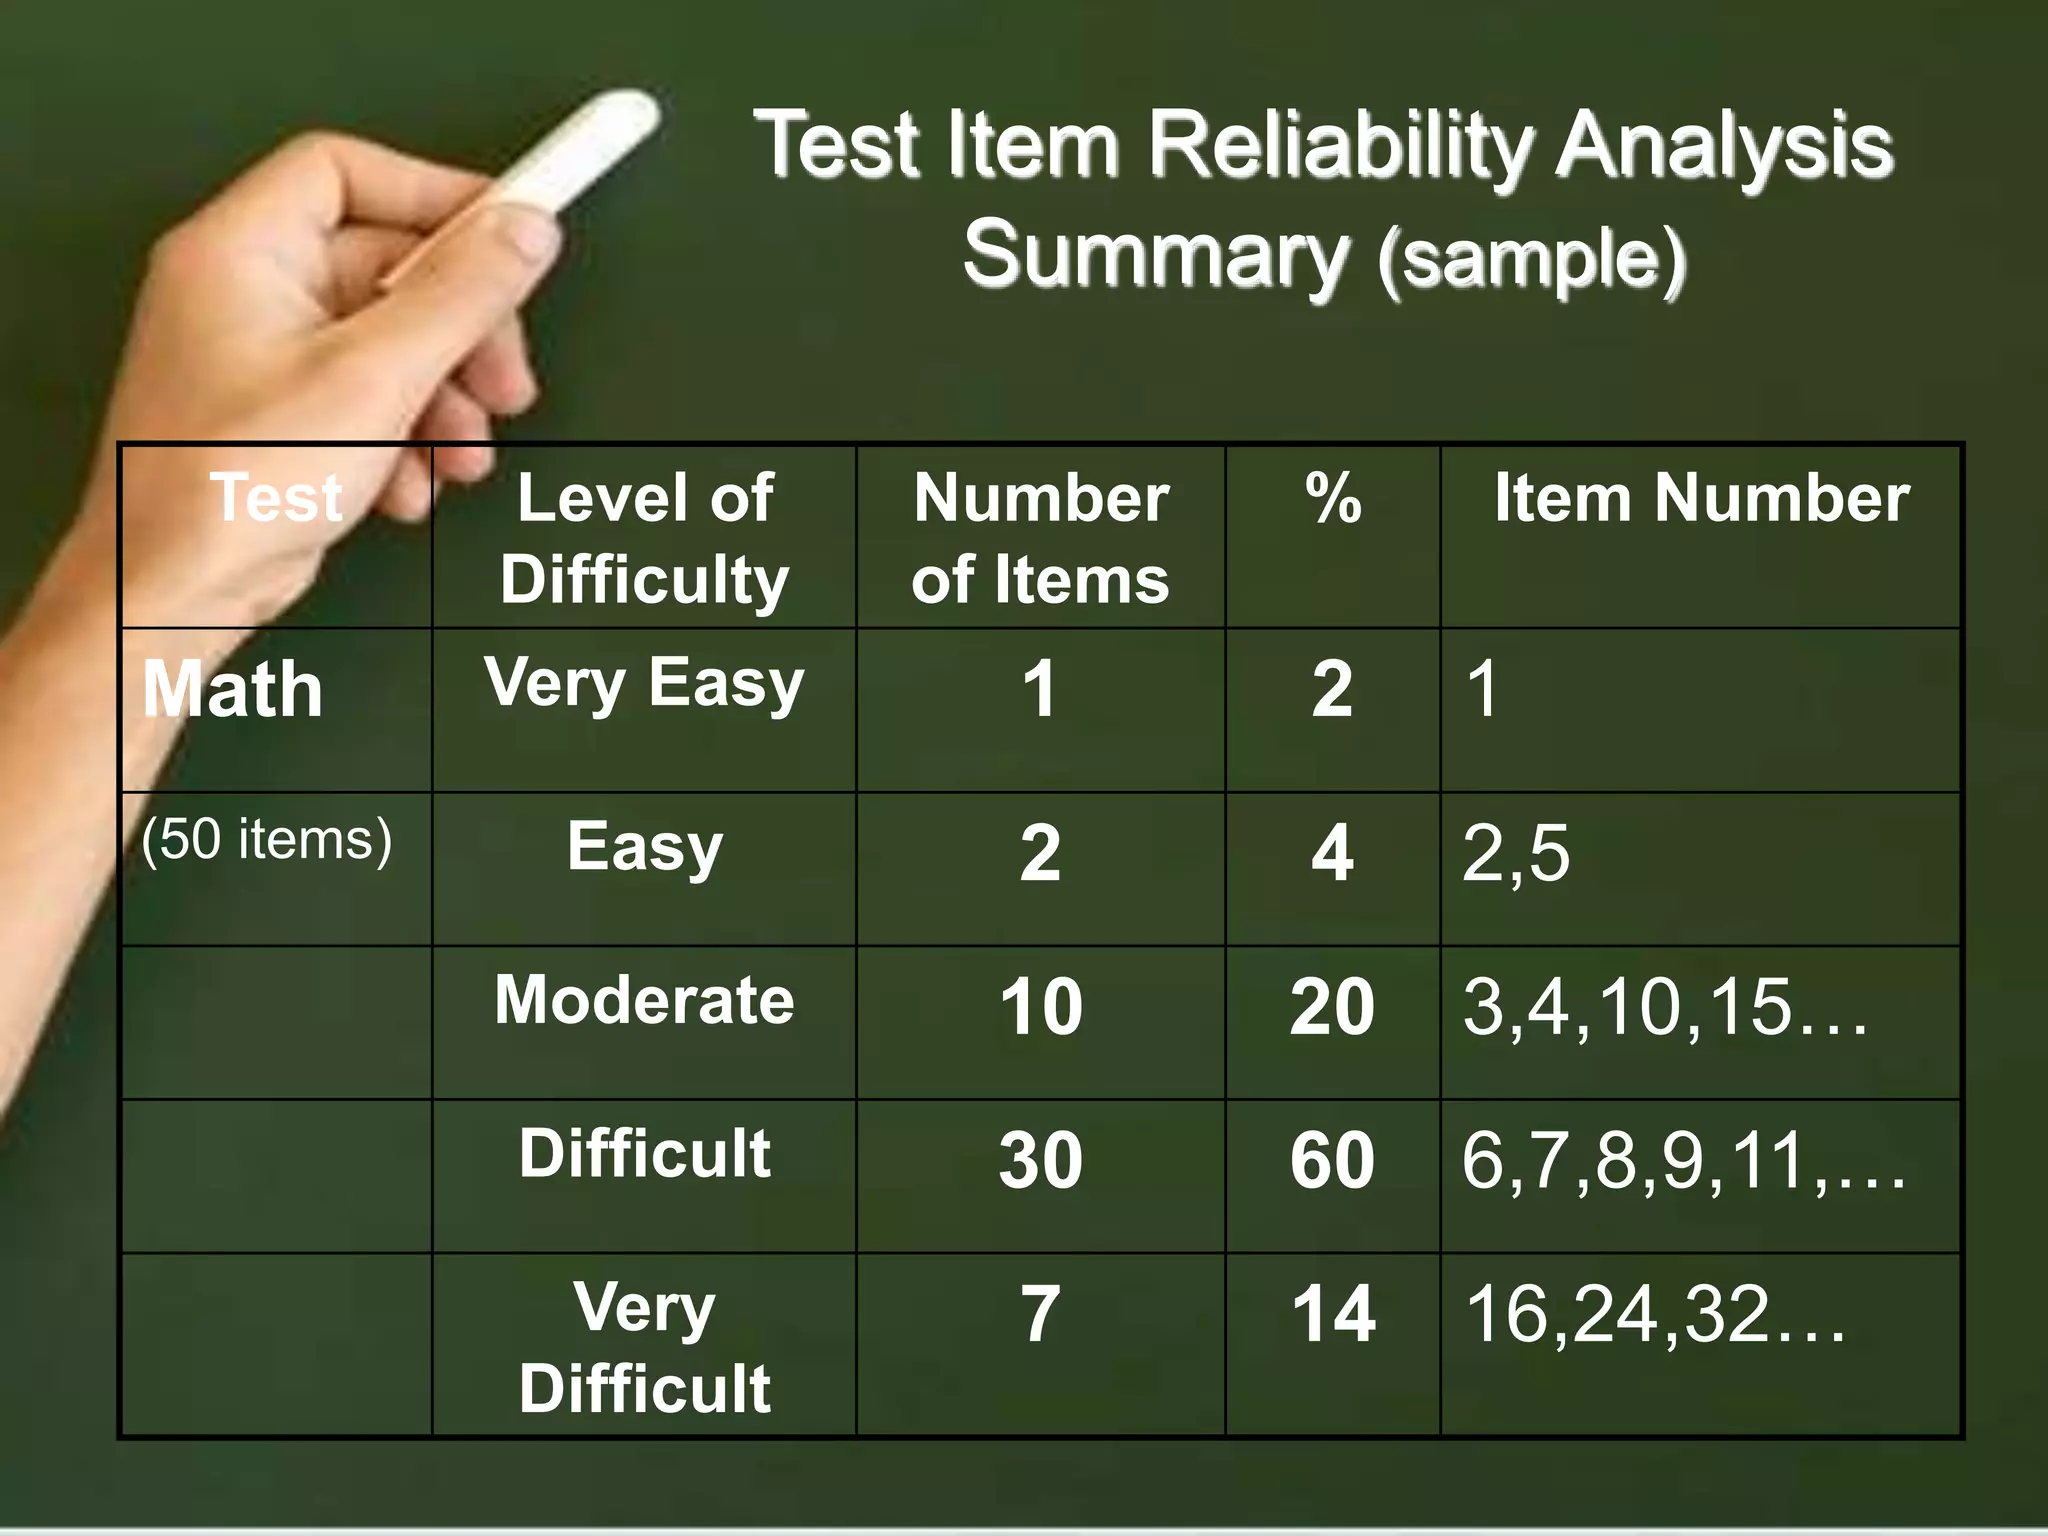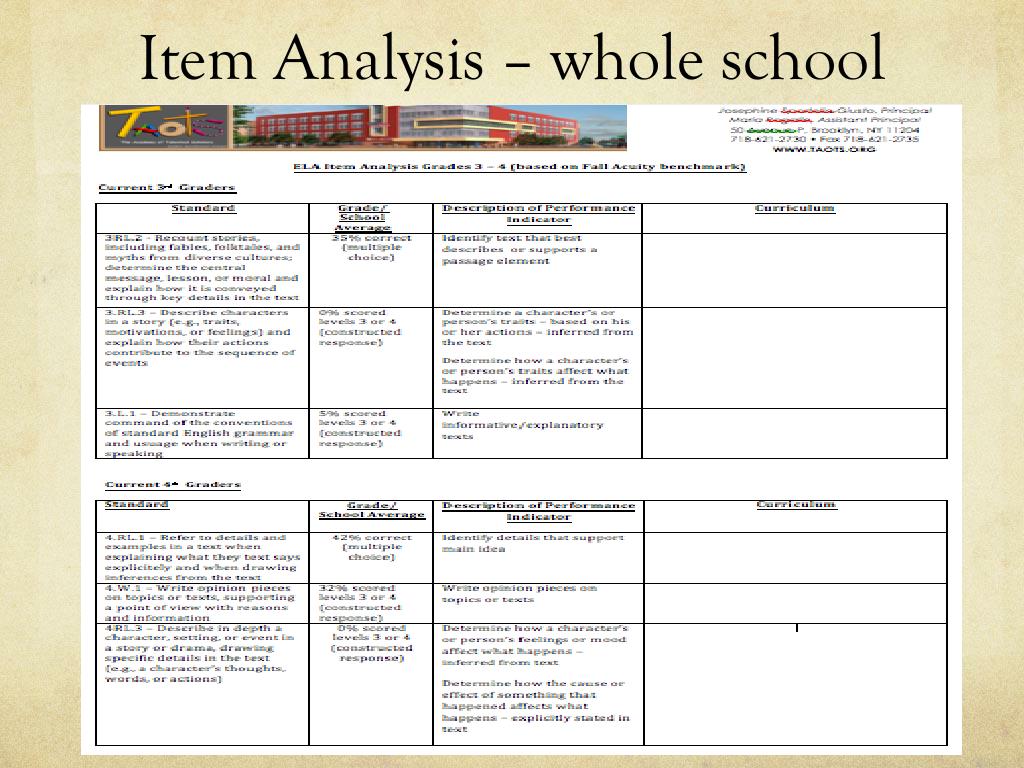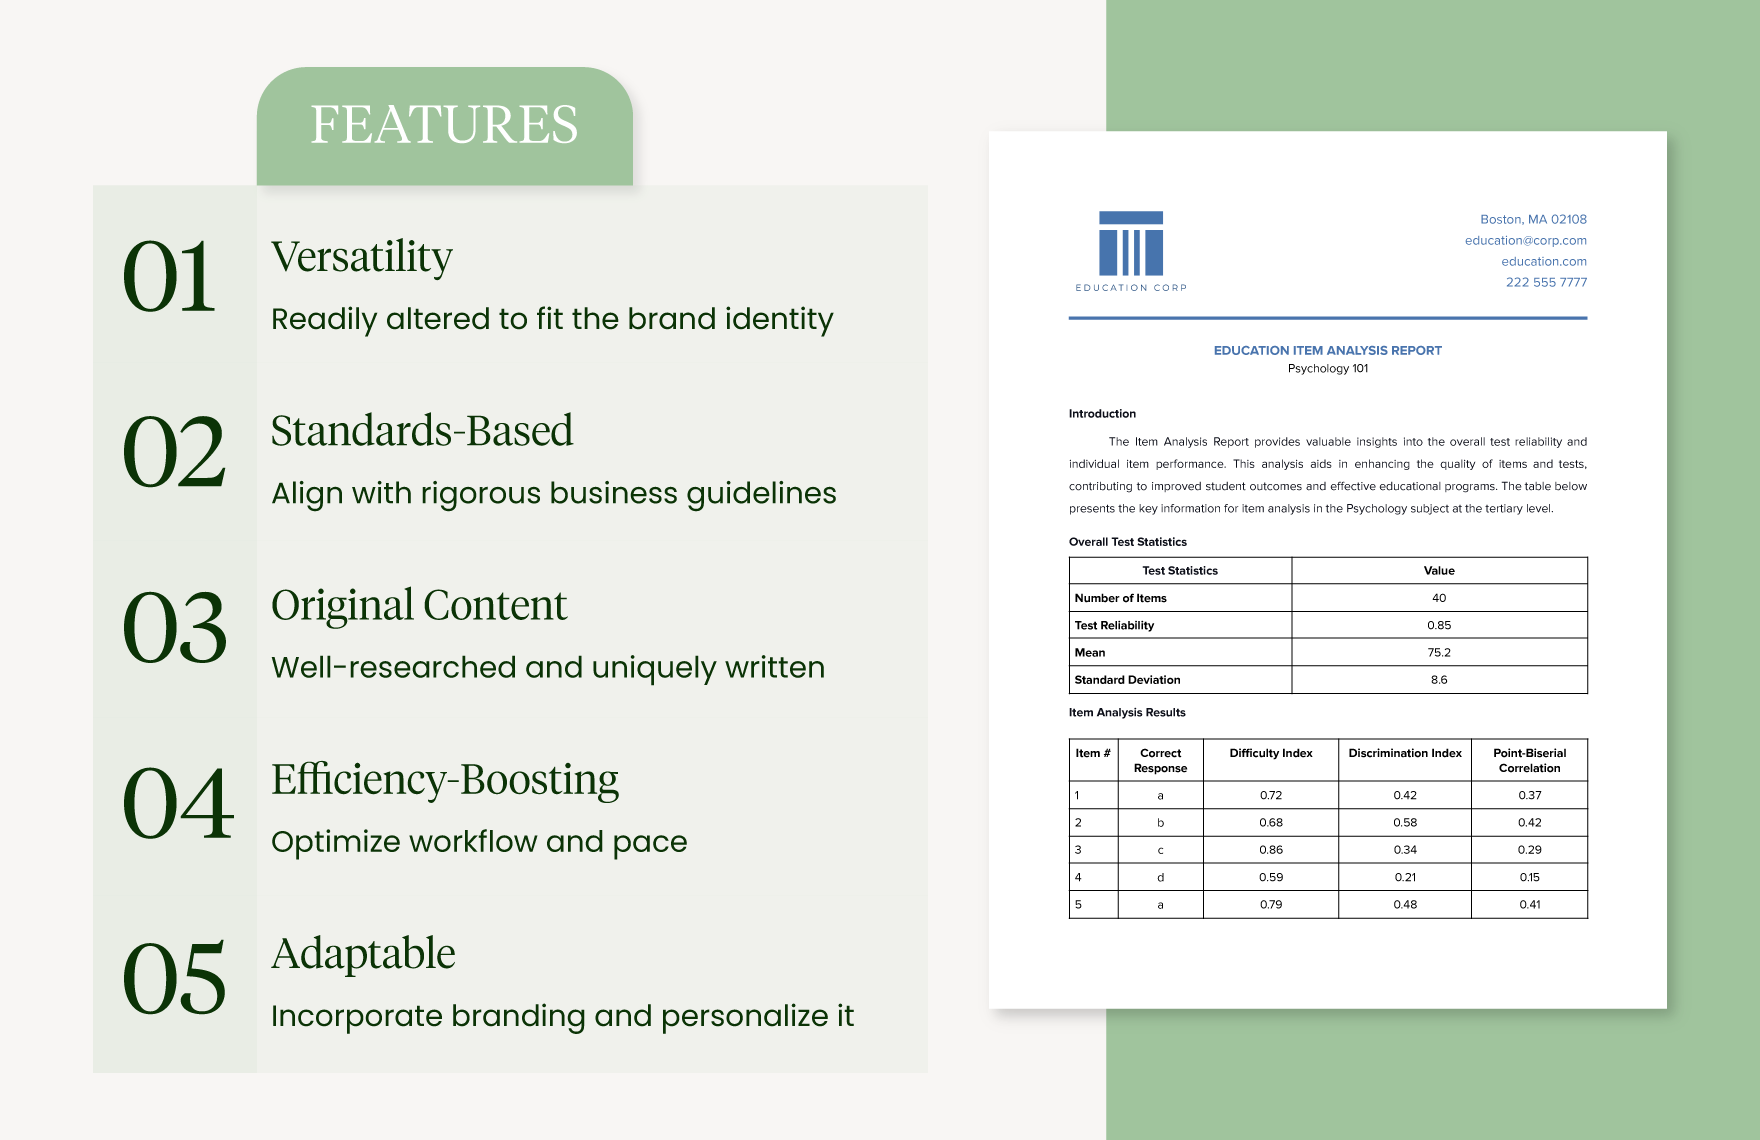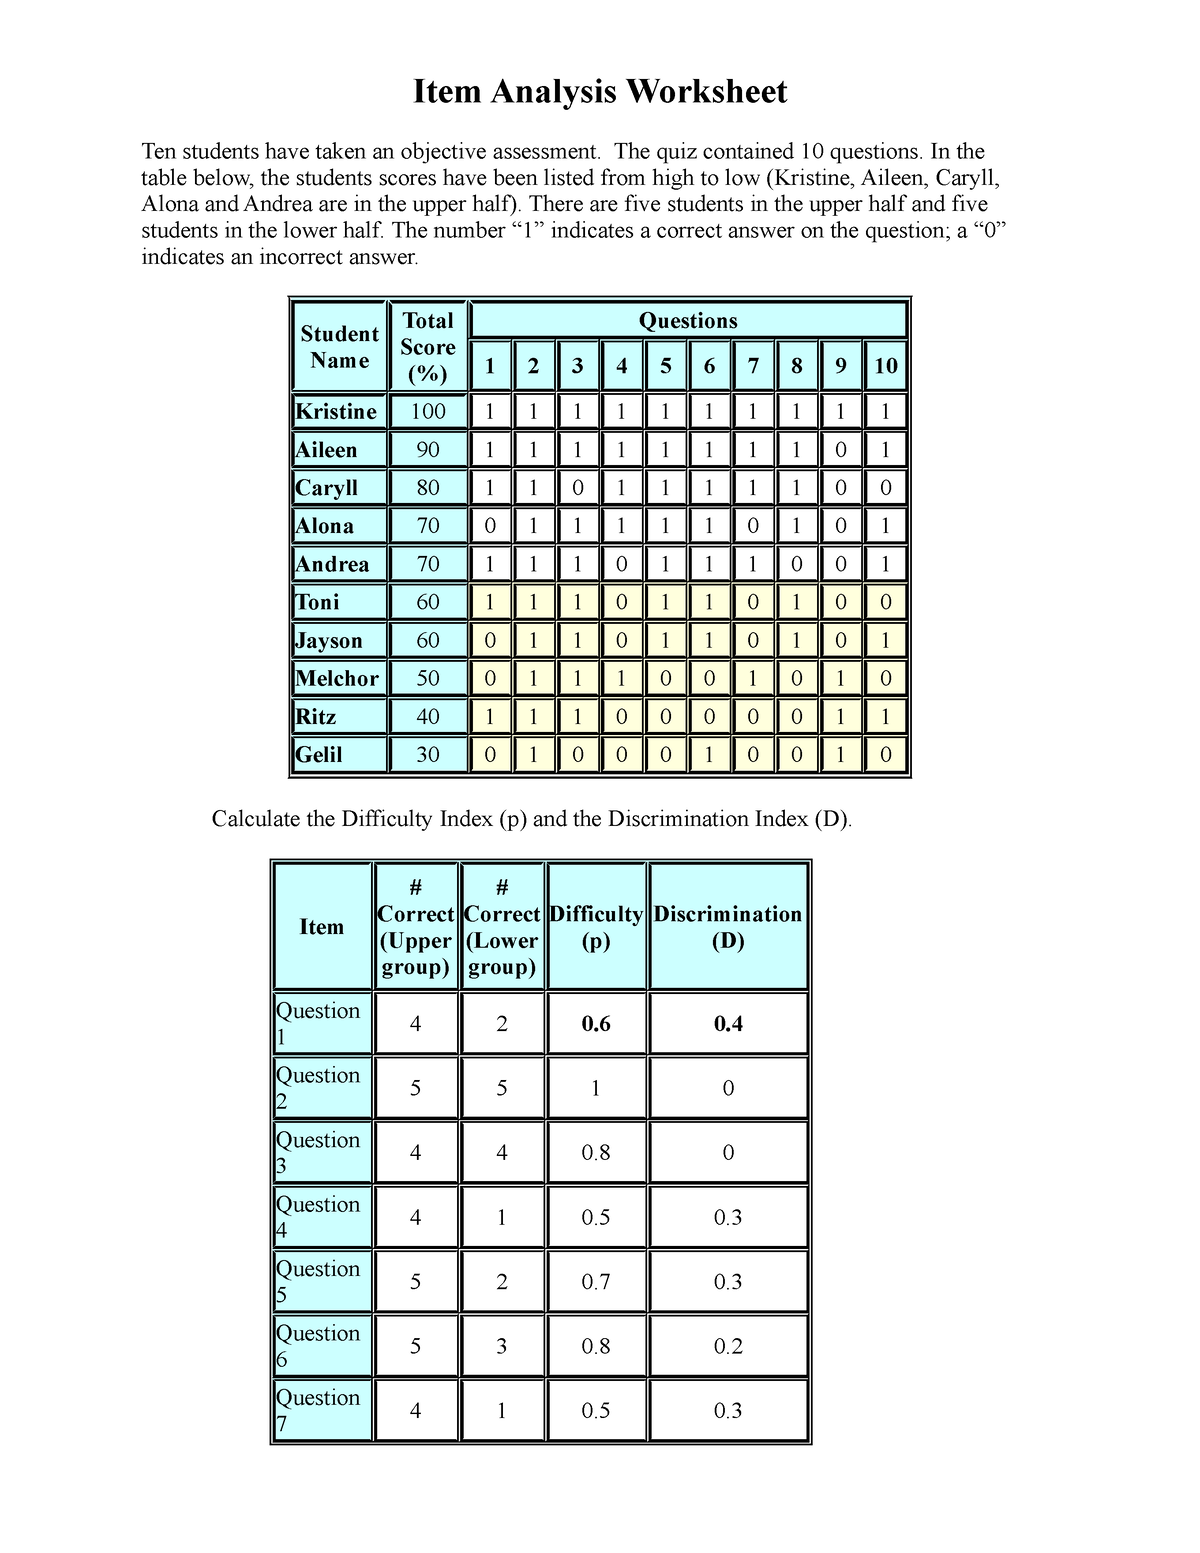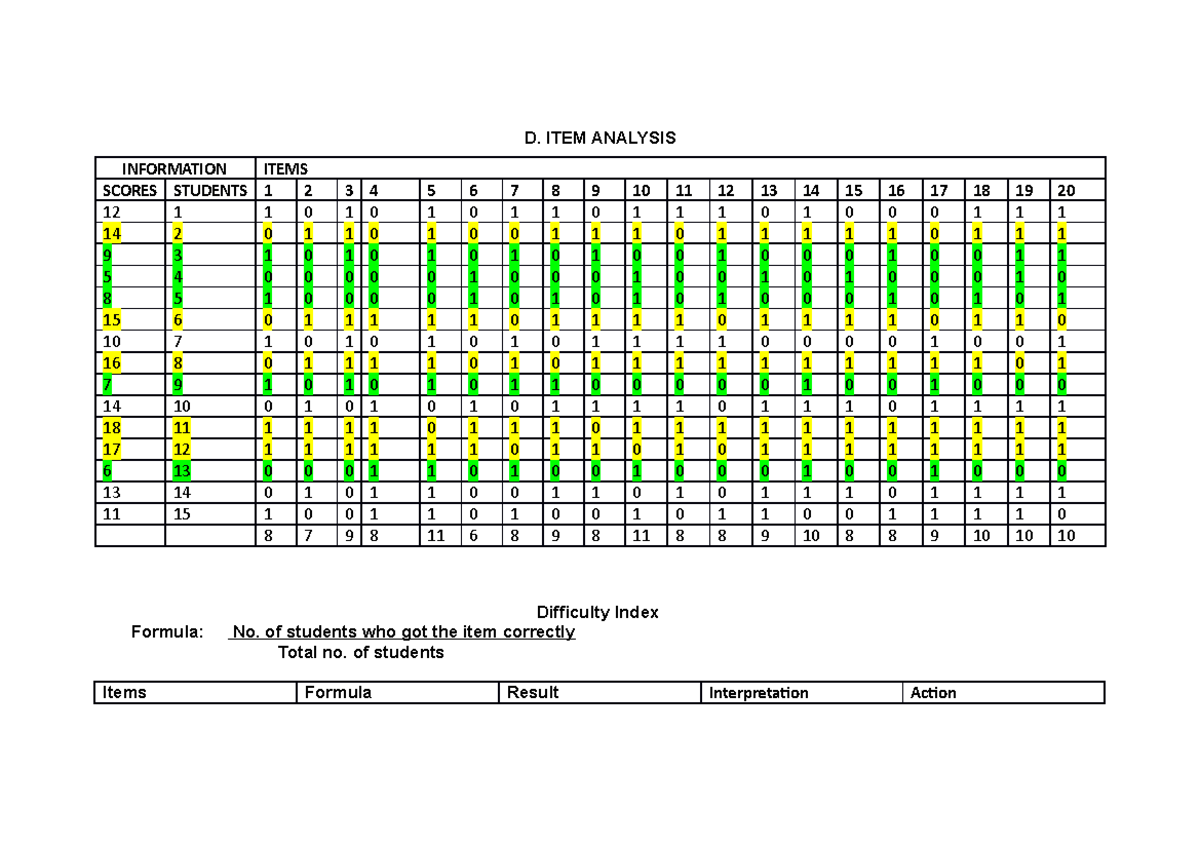
Item Analysis Template For Teachers is a powerful tool that helps educators refine assessment questions, ensuring they accurately measure student understanding while maintaining fairness and reliability. By systematically evaluating each item’s performance—examining difficulty, discrimination, and guessing rates—teachers can transform a standard quiz into a precise diagnostic instrument that informs both instruction and future test design.
What Is Item Analysis and Why It Matters
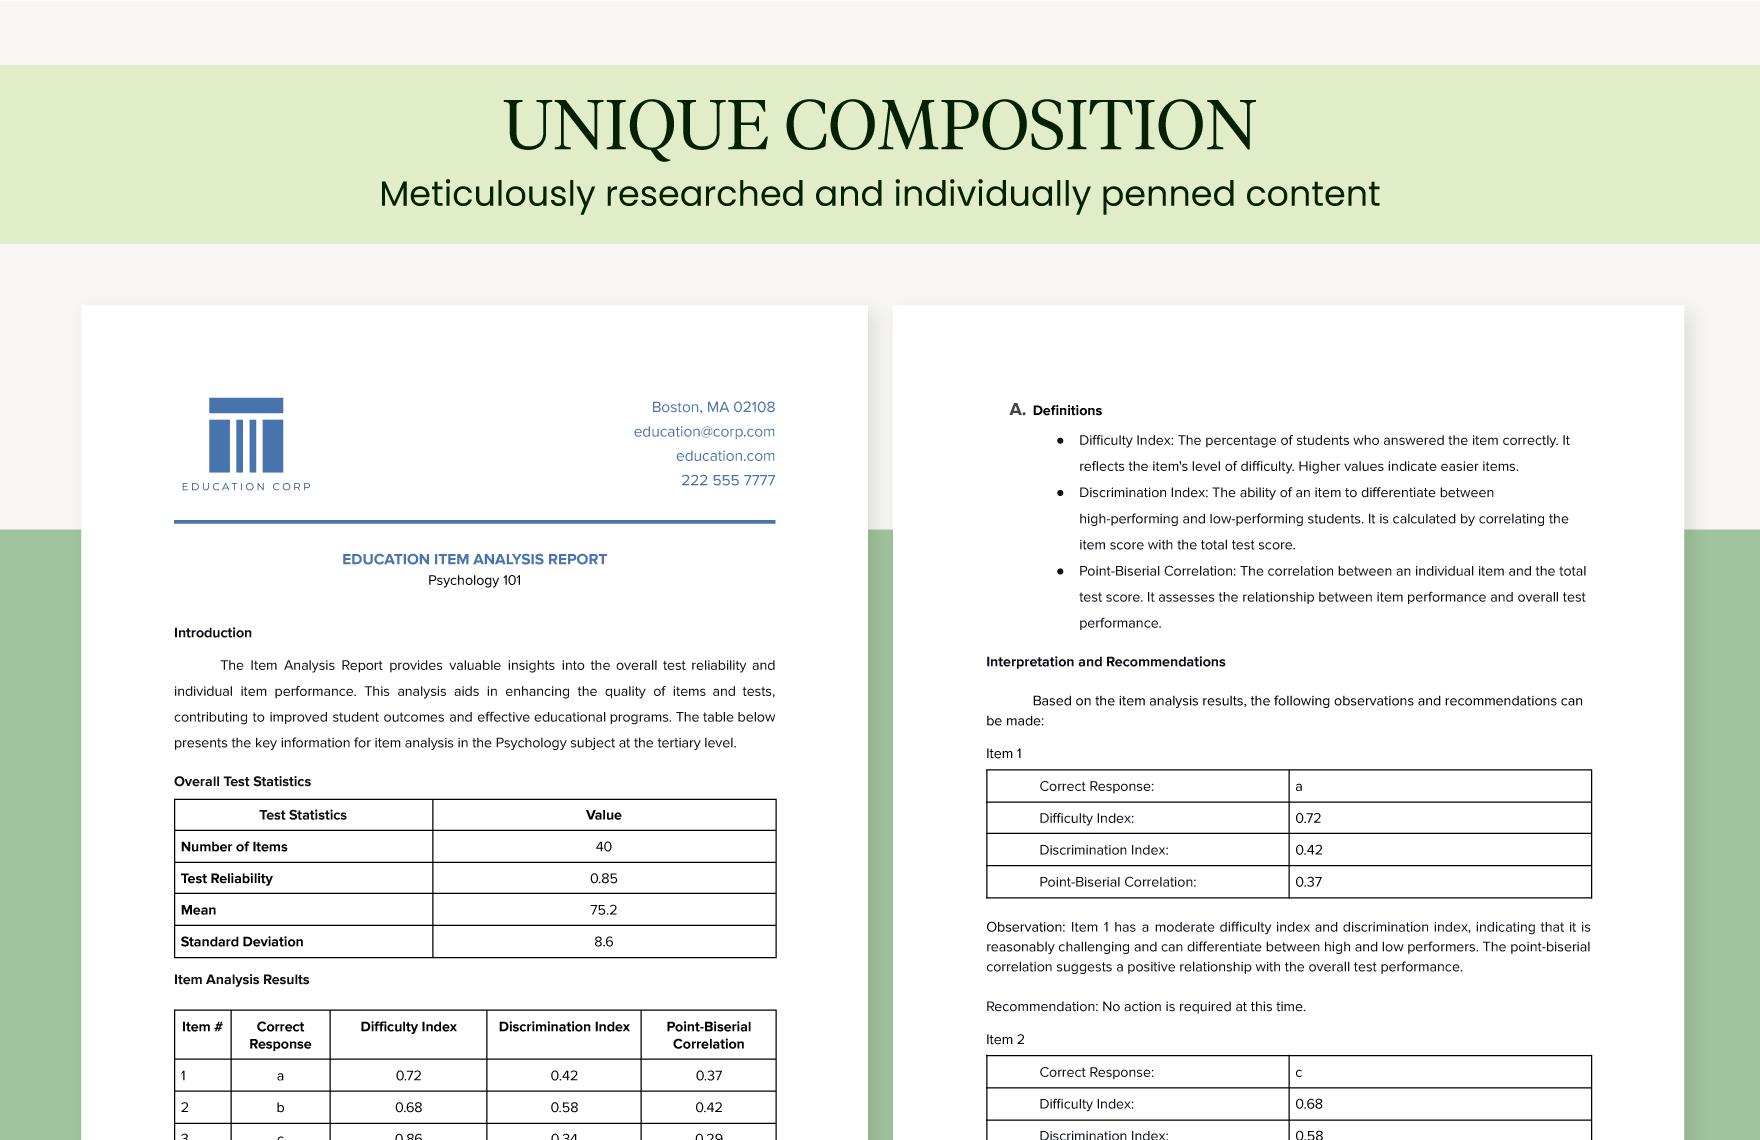
Item analysis is the statistical evaluation of individual test questions after the exam has been administered. Unlike general test grading, which focuses on total scores, item analysis drills down into how each question performed across a student cohort. The primary metrics include:
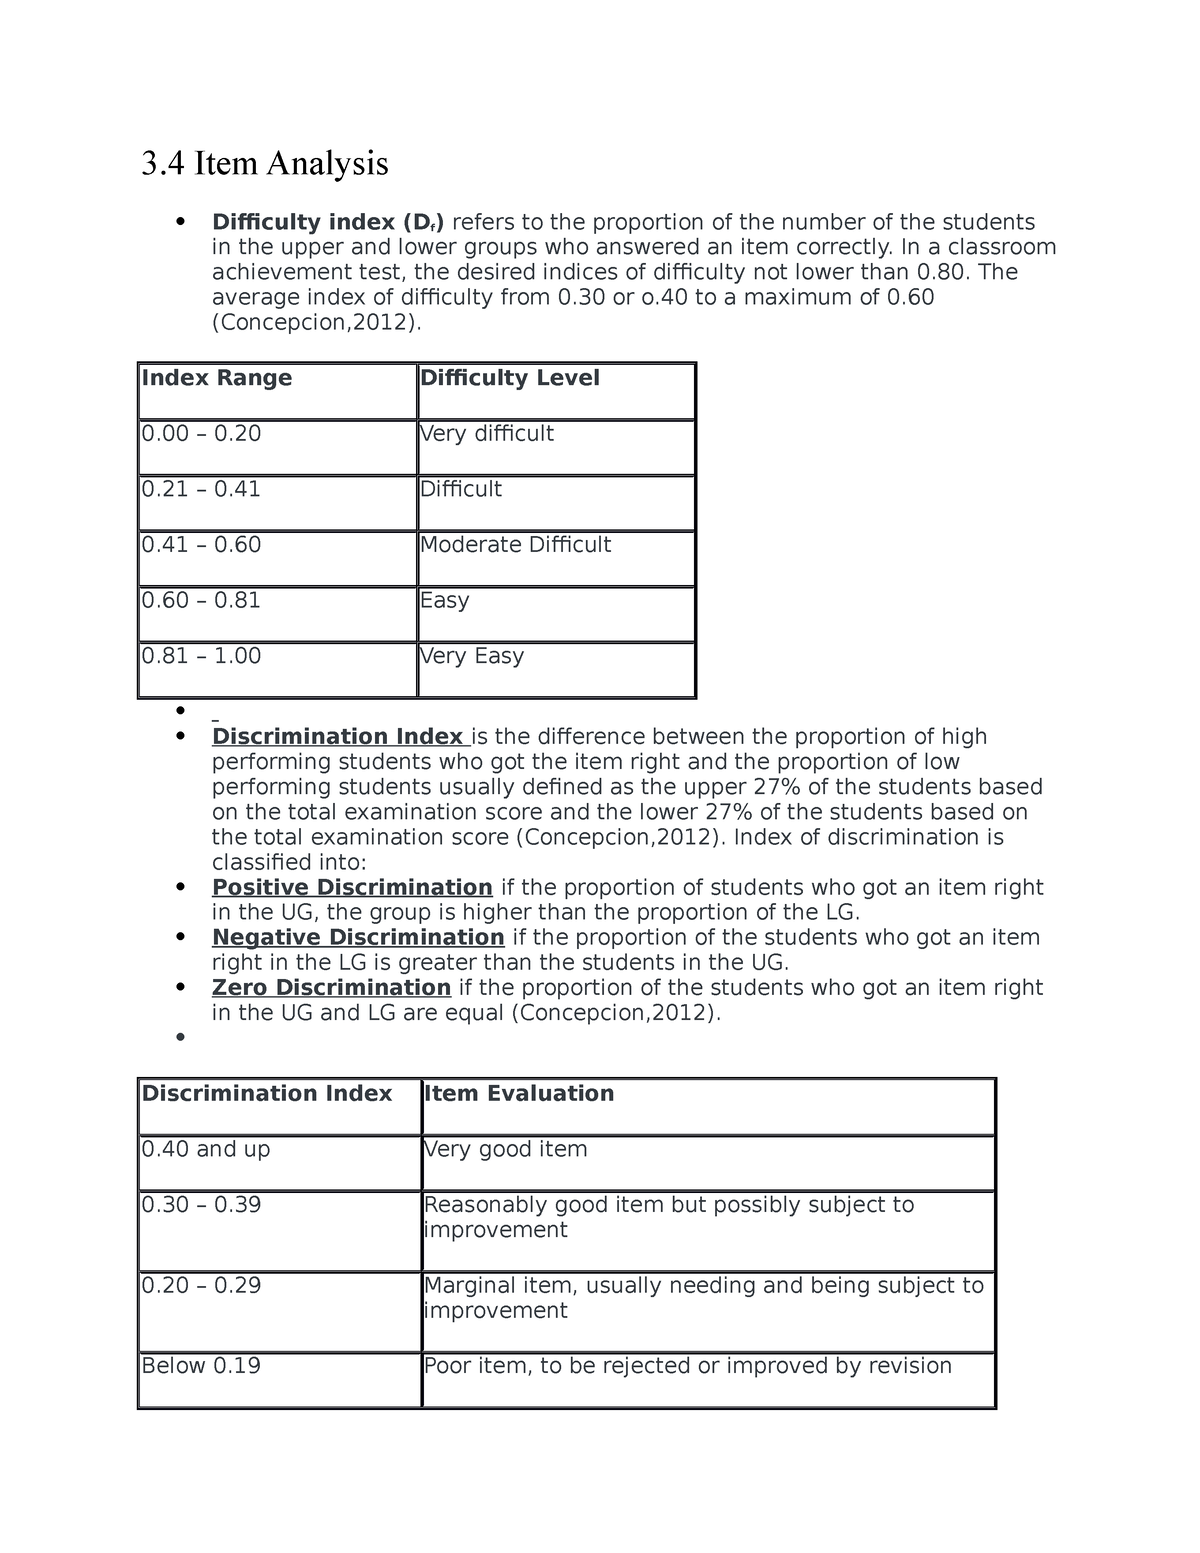
- Difficulty Index – The proportion of students who answered the item correctly.
- Discrimination Index – How well the item differentiates between high‑performing and low‑performing students.
- Guessing Index – The likelihood that students guessed the correct answer rather than understood the concept.
For teachers, these metrics reveal hidden patterns. An item that is too easy may not be testing deeper knowledge, whereas one that is too hard could discourage students. Discriminating items help pinpoint which concepts truly challenge learners and which may need reteaching.
Components of a Standard Item Analysis Template
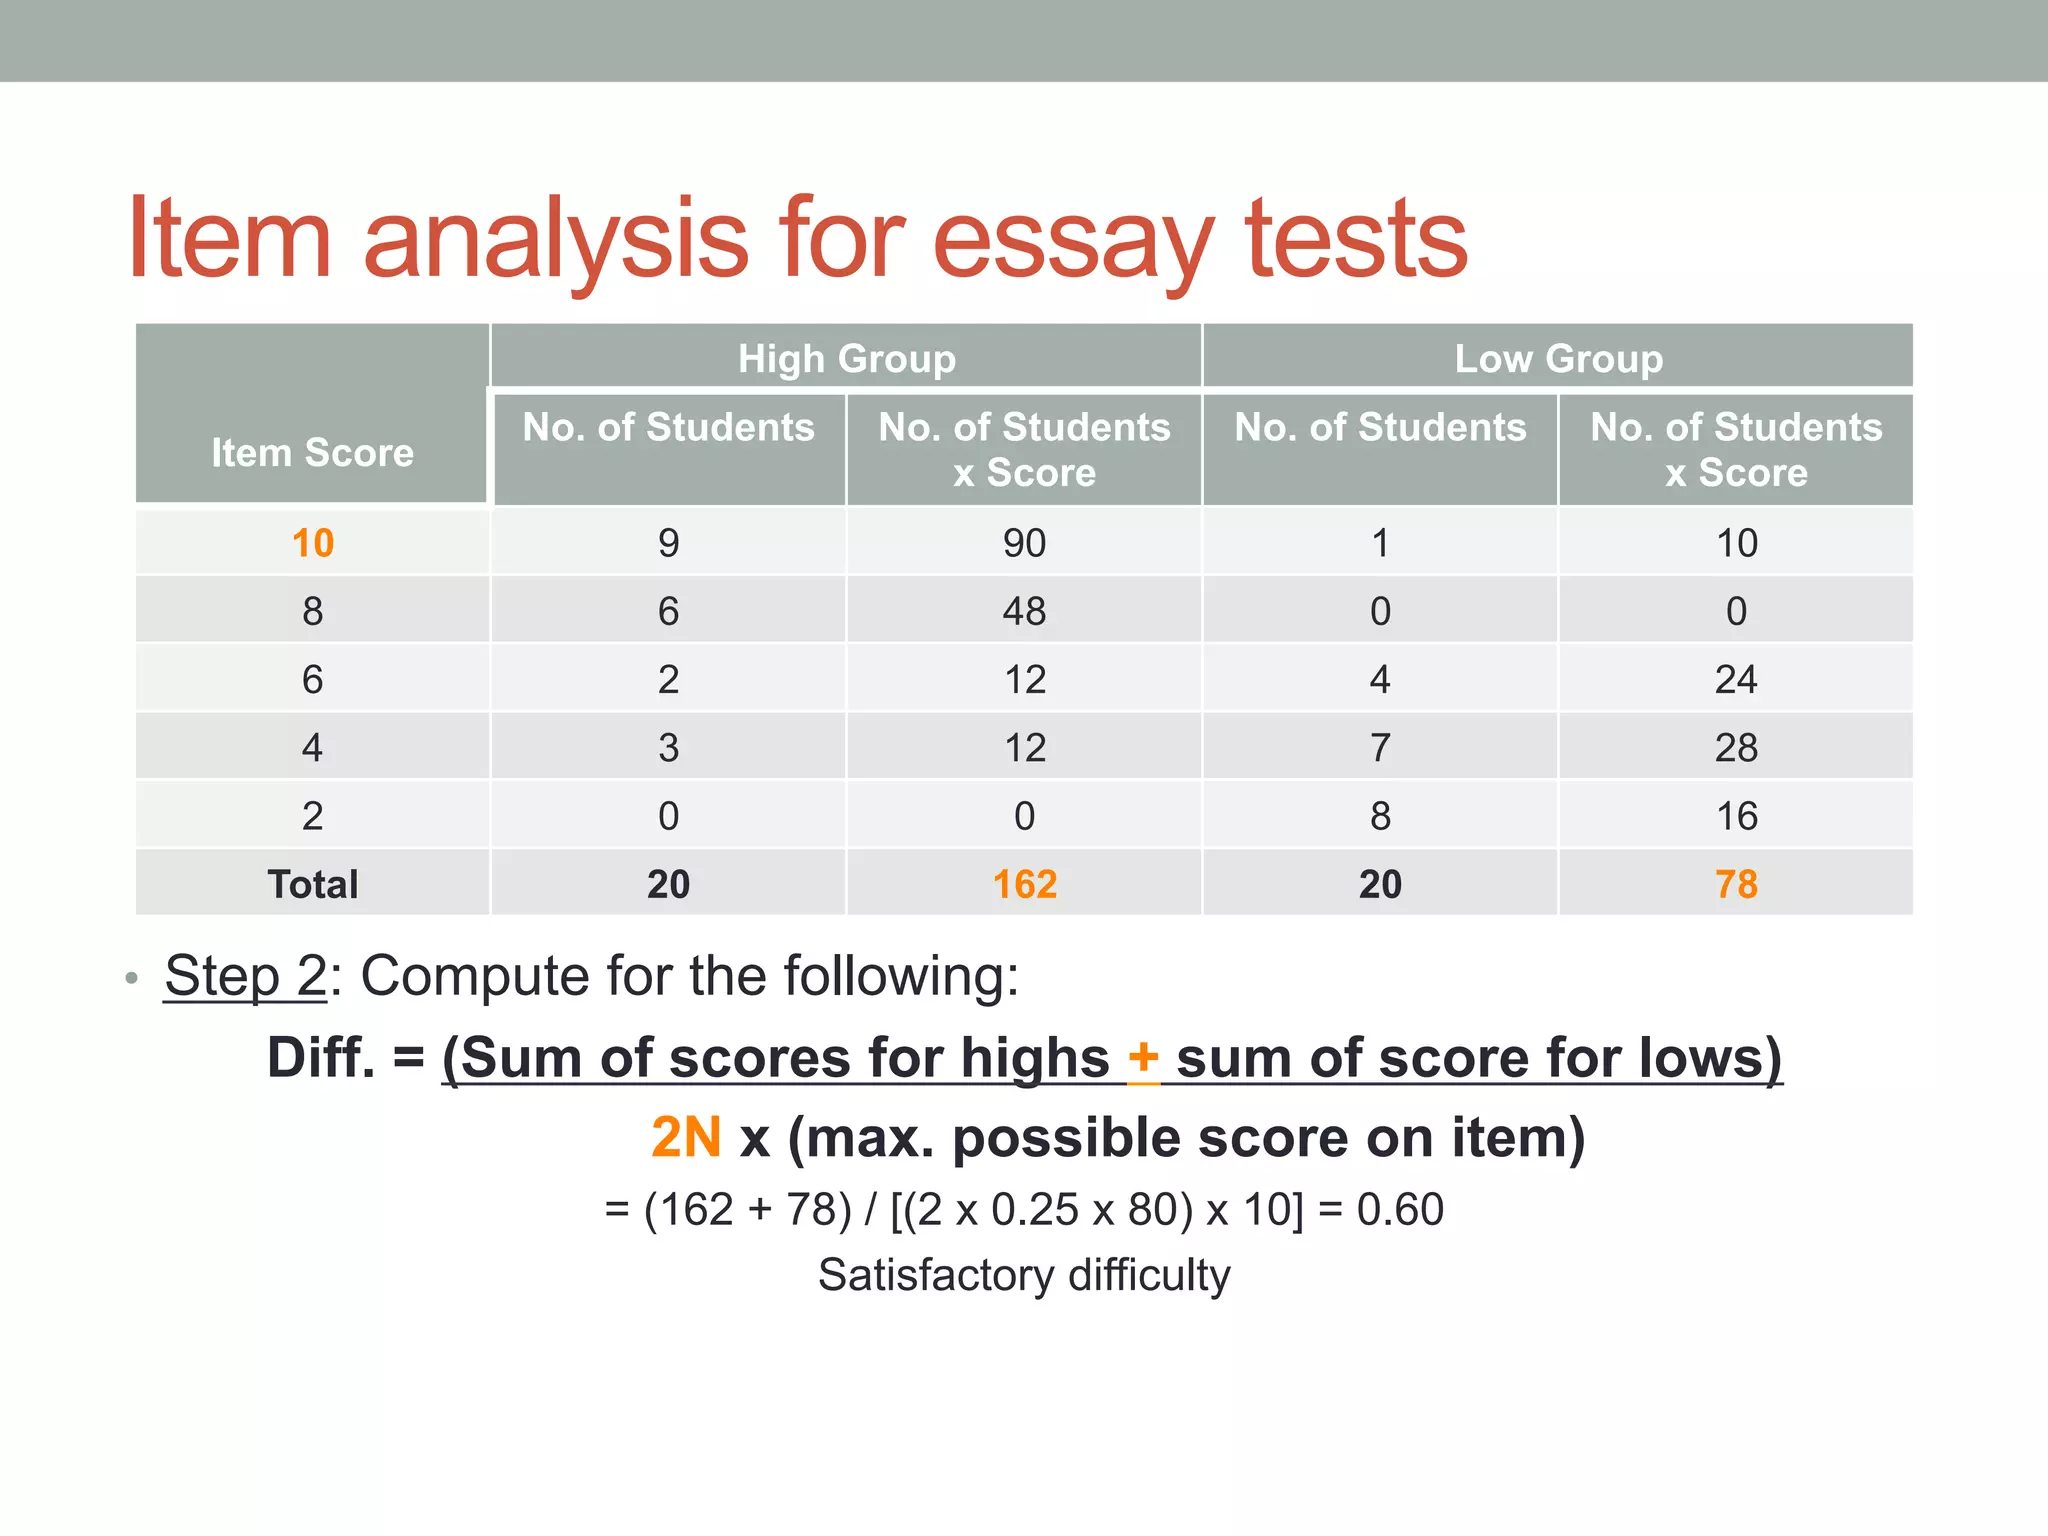
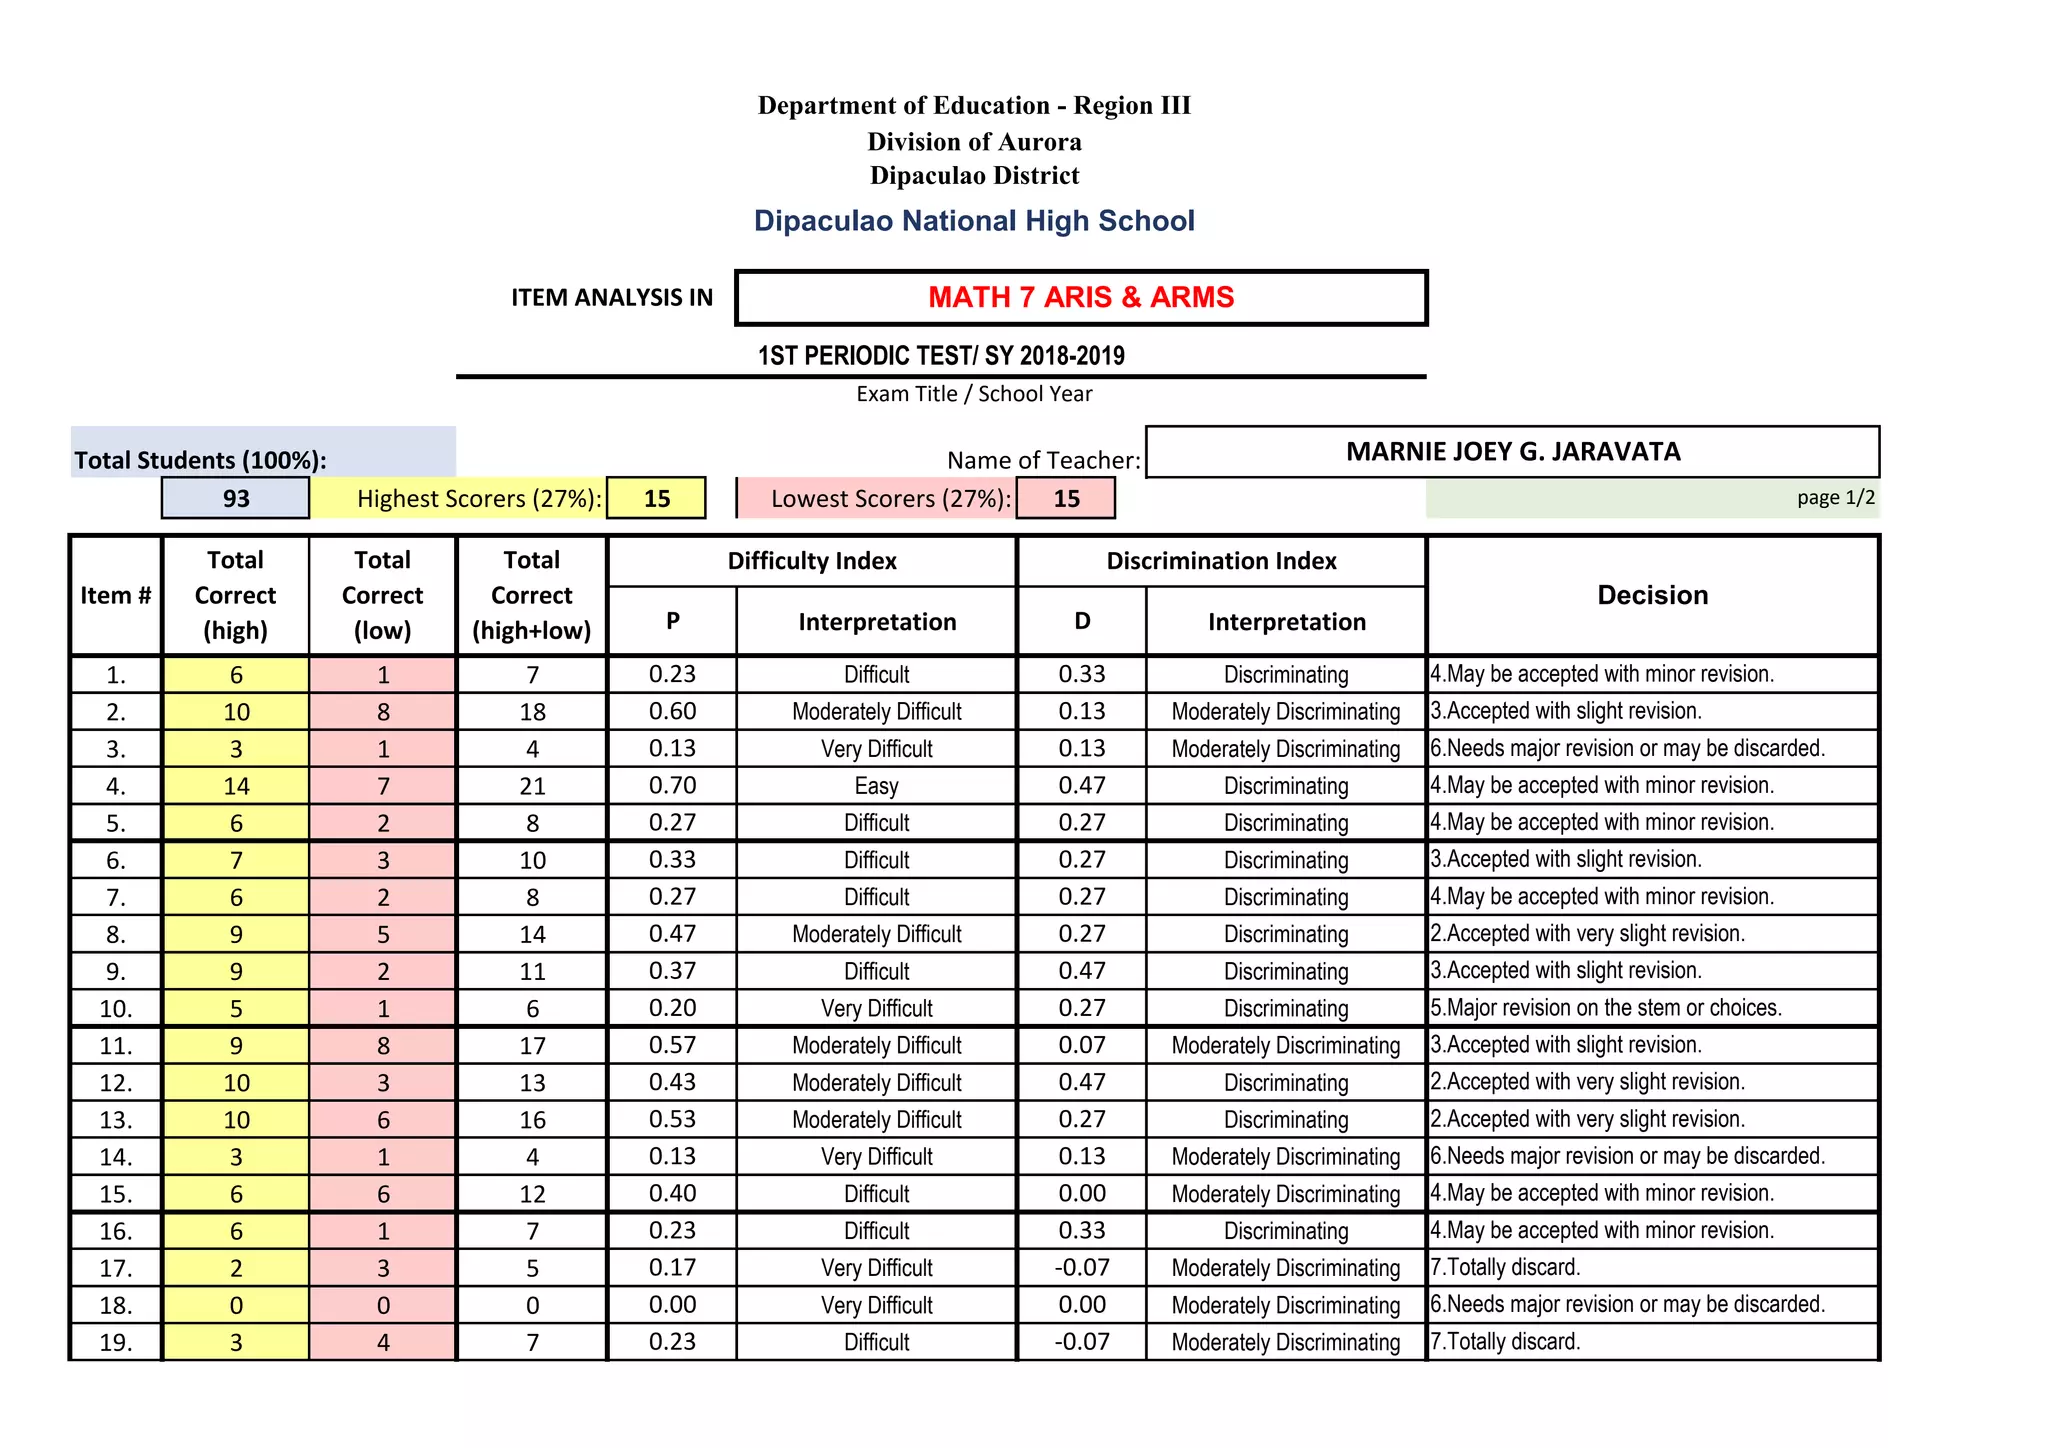
A well‑structured template guides teachers through a comprehensive review of each item. Below are the essential sections that should appear in a professional item analysis worksheet:
Question Identification
Each item should have a clear identifier—question number, topic, and any sub‑topic tags. This facilitates quick cross‑referencing when revising content or aligning with curriculum standards.
Difficulty Index Calculation
Include a column for raw scores, followed by a formula that divides the number of correct responses by the total number of students. A value close to 0.5 is often considered ideal, striking a balance between challenge and attainability.
Discrimination Index Calculation
Here, the template should list the highest and lowest score groups (e.g., top 27% and bottom 27%) and the proportion of correct answers within each group. The difference between these proportions indicates discrimination strength.
Guessing Index or P-Value
For multiple‑choice items, calculate the chance probability. A lower guessing index suggests the item is more robust against random guessing.
Comments & Recommendations
A free‑text area where teachers can note observations such as ambiguous wording, cultural biases, or logistical issues (e.g., mis‑spelling or mis‑placement of answer choices).
Revision Status
Mark whether the item will be kept, revised, or discarded based on the analysis. This tracking aids in maintaining a dynamic assessment repository.
Step‑by‑Step Guide to Using the Template

Step 1: Gather Raw Data
After the test, export the answer key and student responses into a spreadsheet or data‑analysis software. Ensure anonymity by assigning unique student IDs rather than names.
Step 2: Input Basic Information
Populate the template with question identifiers and answer choices. Double‑check for consistency in numbering and formatting.
Step 3: Calculate Difficulty Index
Use a simple formula: Difficulty Index = (Number of Correct Answers / Total Students) × 100%. Enter the result in the dedicated column.
Step 4: Compute Discrimination Index
Identify the top and bottom scoring groups. Count correct responses for each group, calculate percentages, then subtract the lower group percentage from the higher group percentage. A positive value above 0.20 is usually desirable.
Step 5: Evaluate Guessing Index
For four‑choice items, a theoretical guessing rate is 25%. Compare this to the observed proportion of correct answers for low‑performing students. A large discrepancy may indicate a misleading clue.
Step 6: Record Observations
In the comments section, note any qualitative concerns—e.g., “Vocab word may be unfamiliar to some students” or “Distractor appears too similar to correct answer.”
Step 7: Decide on Revisions
Based on the quantitative metrics and qualitative notes, mark each item as “Keep,” “Revise,” or “Discard.” For revisions, draft alternative wording or distractor options and re‑run the analysis after a pilot test.
Sample Layout: How a Complete Template Looks

Below is a text‑based representation of a typical item analysis template. Though visual design varies, the structure remains consistent across platforms:
- Item Number
- Question Text
- Correct Answer
- Difficulty Index
- Discrimination Index
- Guessing Index
- Comments
- Revision Status
Teachers can create this layout in Excel, Google Sheets, or a specialized assessment software that auto‑calculates indices.
Common Pitfalls and How to Avoid Them
Overlooking Statistical Significance
A low discrimination index may simply be due to a small sample size. When dealing with classes of fewer than 30 students, interpret results cautiously and supplement with qualitative feedback.
Ignoring Cultural Context
In Asian classrooms, certain terms or references may be culturally specific. A question that appears straightforward to a teacher might be ambiguous to students from different regions or socio‑economic backgrounds. Always pilot test with a diverse sample.
Failing to Update the Item Pool
Once items are revised, they should be re‑entered into the template and re‑tested. Stagnant items risk becoming outdated, especially in fast‑evolving subjects like STEM.
Misapplying Discrimination Thresholds
While a 0.20 threshold is common, the acceptable range can vary by subject and assessment type. For formative quizzes, slightly lower discrimination may be acceptable, whereas high‑stakes exams demand stricter metrics.
Integrating Technology for Efficient Analysis

Learning Management Systems (LMS)
Platforms like Google Classroom, Moodle, or Blackboard often export raw data in CSV format, ready for analysis. Some LMSs provide built‑in item analysis tools that automatically populate difficulty and discrimination metrics.
Statistical Software
SPSS, R, and Python libraries such as Pandas and NumPy can handle larger datasets and offer advanced visualization (e.g., item‑characteristic curves). This is particularly useful for teachers involved in research or curriculum development.
Template Automation
Using conditional formatting in spreadsheets can flag items that fall outside desired ranges. For example, set a rule to color cells red when the discrimination index is below 0.10, making it easy to spot problematic questions at a glance.
Real‑World Examples from Asian Classrooms
High‑School Physics in Singapore
One teacher used item analysis after a unit on electromagnetism. Several multiple‑choice questions about Faraday’s law showed a difficulty index of 0.15, indicating a gap in prerequisite knowledge. By revising the wording and adding a conceptual diagram, the next iteration raised the index to 0.48 and increased discrimination from 0.12 to 0.35.
College Mathematics in Japan
In a calculus course, the instructor applied item analysis to a midterm exam. An item requiring the integration of a trigonometric function had a high guessing index, suggesting that distractors were too similar. The teacher redesigned the distractors, resulting in a lower guessing rate and a higher discrimination index, thus better differentiating students who truly mastered the technique.
English Language Assessment in South Korea
A language teacher employed a template to evaluate reading comprehension passages. The difficulty index for a particular passage was too high (0.75). By shortening the text and simplifying vocabulary, the teacher lowered the difficulty to 0.55, while preserving the key grammatical point. This adjustment led to a more balanced assessment that matched the class’s proficiency level.
Advanced Tips for Complex Assessments
Item Response Theory (IRT) Integration
For teachers working with large standardized tests, IRT provides a more nuanced analysis by modeling student ability and item difficulty simultaneously. Incorporating IRT into the template can enhance predictive validity.
Longitudinal Item Analysis
Track item performance over multiple semesters. This longitudinal perspective helps identify items that consistently underperform, allowing for systematic refinement or removal.
Peer Review of Items
Encourage a collaborative review where classmates analyze each other’s items using the template. Peer feedback can uncover overlooked biases and improve overall question quality.
Conclusion
Adopting a disciplined approach to item analysis equips teachers with a clear, data‑driven picture of their assessment strengths and weaknesses. By meticulously applying the Item Analysis Template For Teachers, educators in Asian contexts can tailor their questions to better reflect student learning, enhance test fairness, and ultimately foster a more engaging and effective learning environment. The process may seem detailed, but the payoff—higher instructional clarity, more accurate student feedback, and continuous improvement of assessment tools—makes it an indispensable part of modern teaching practice.