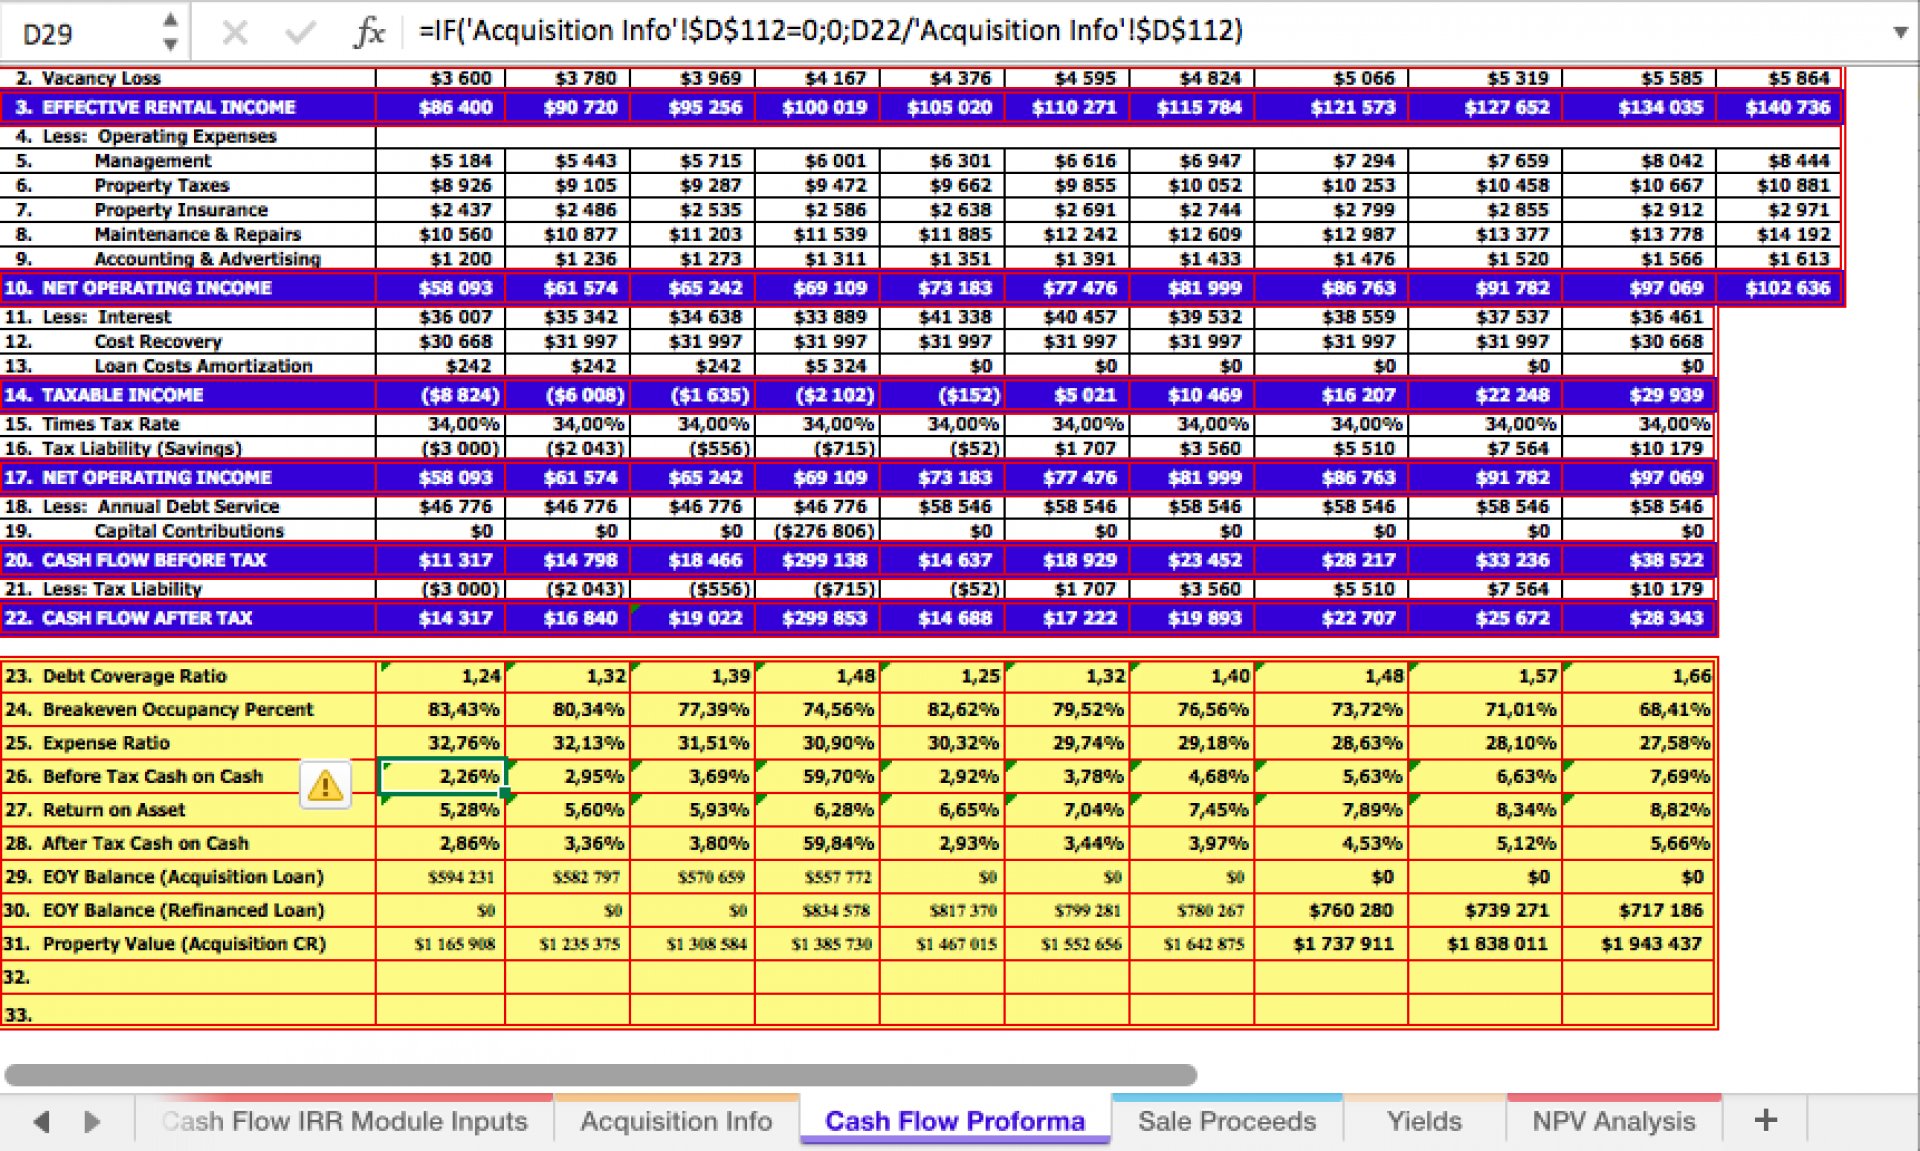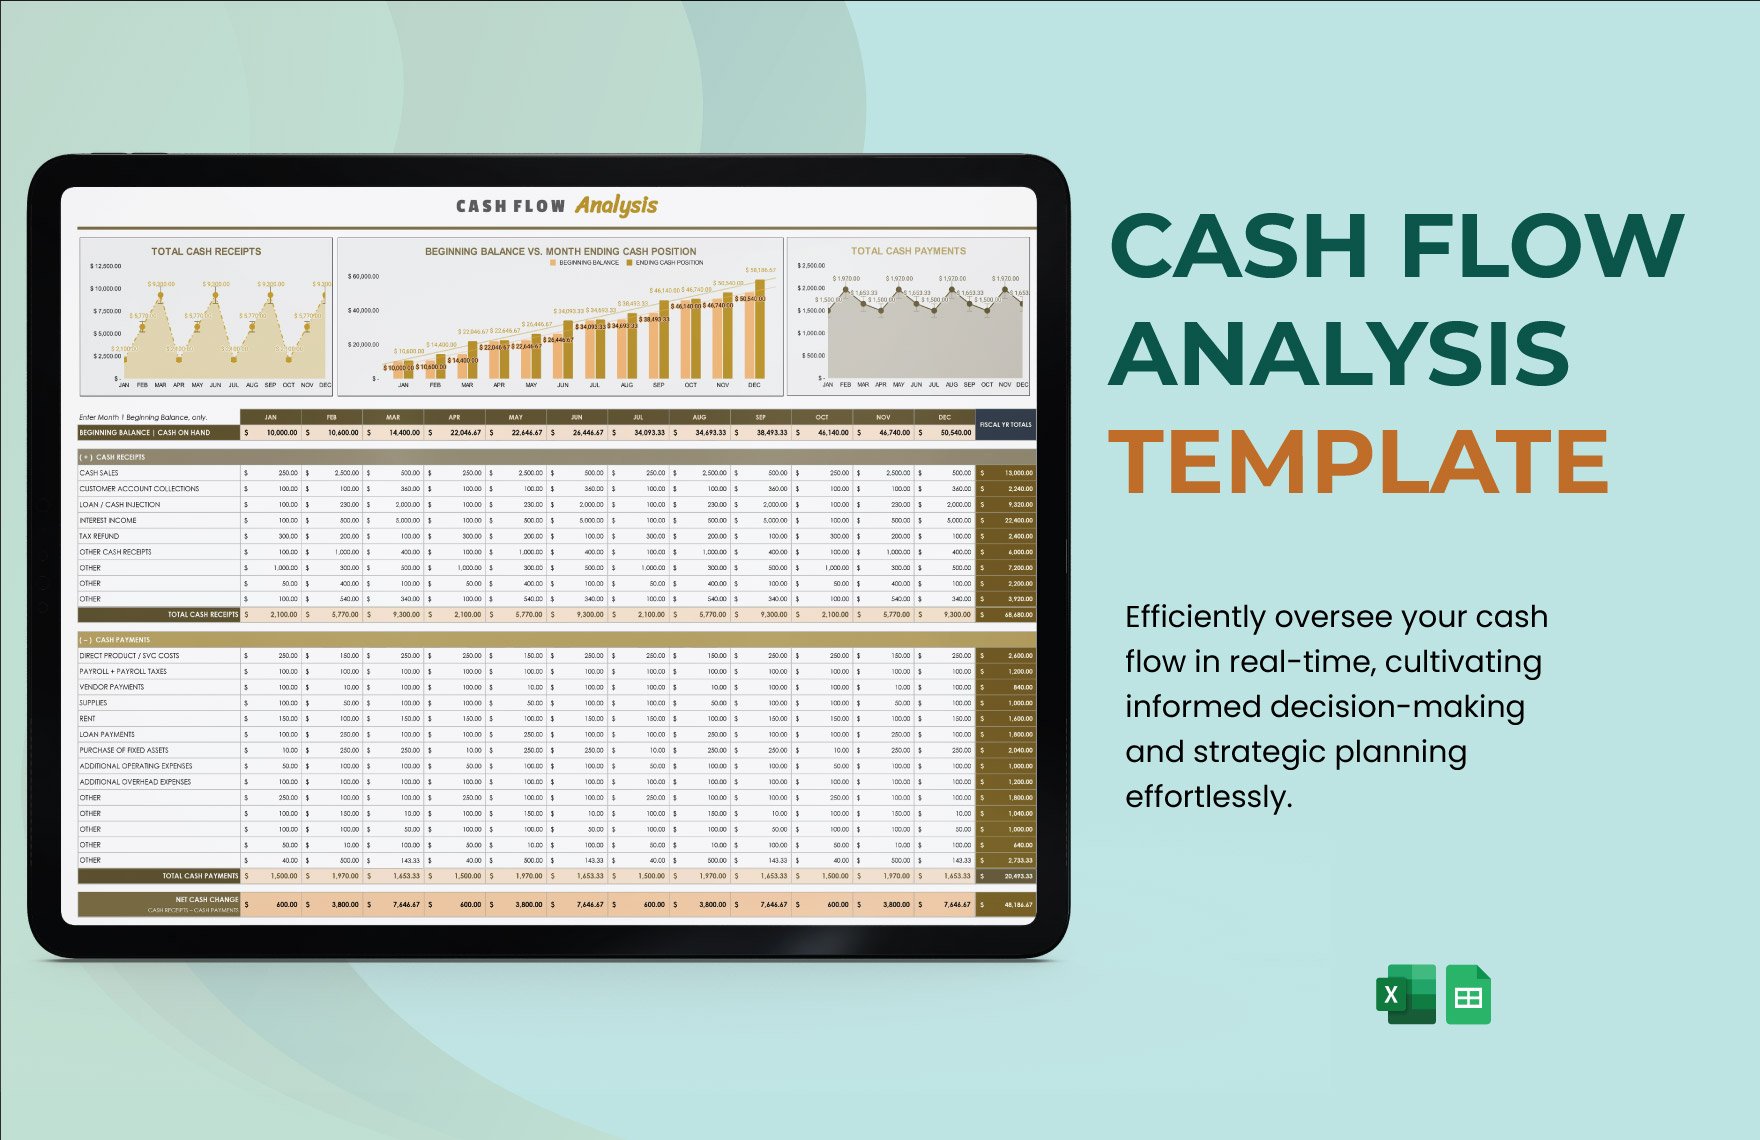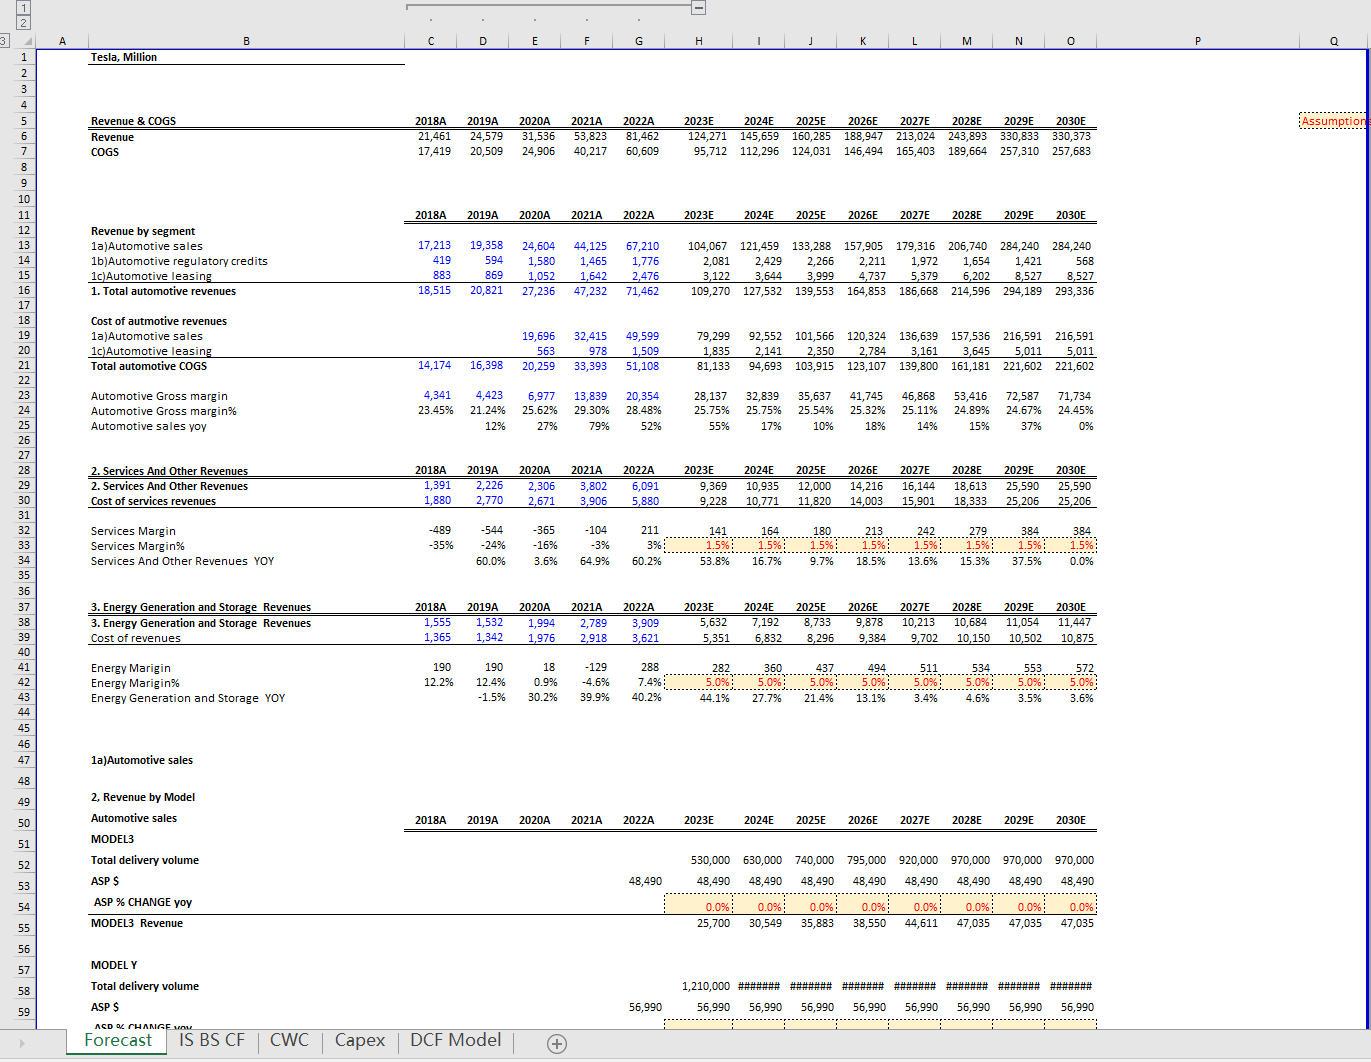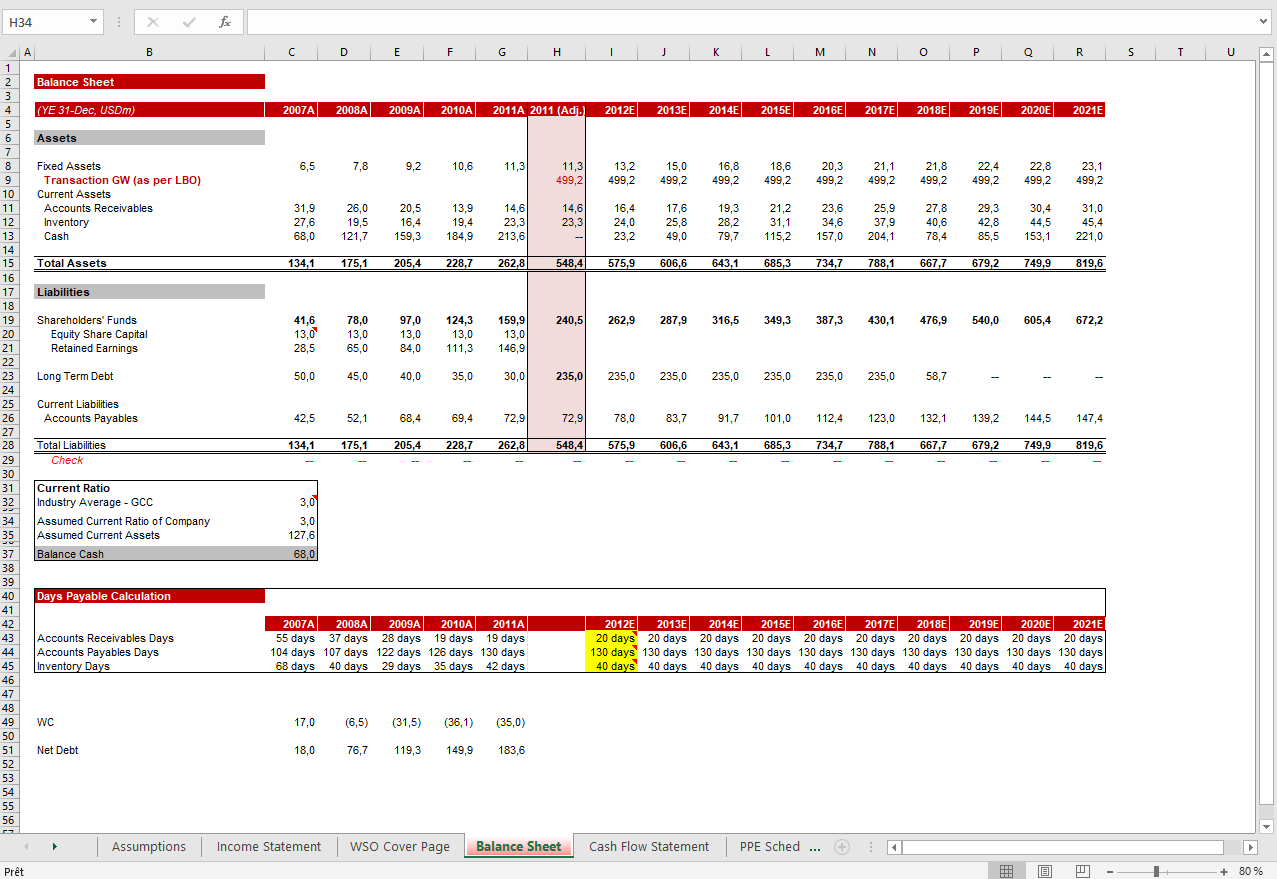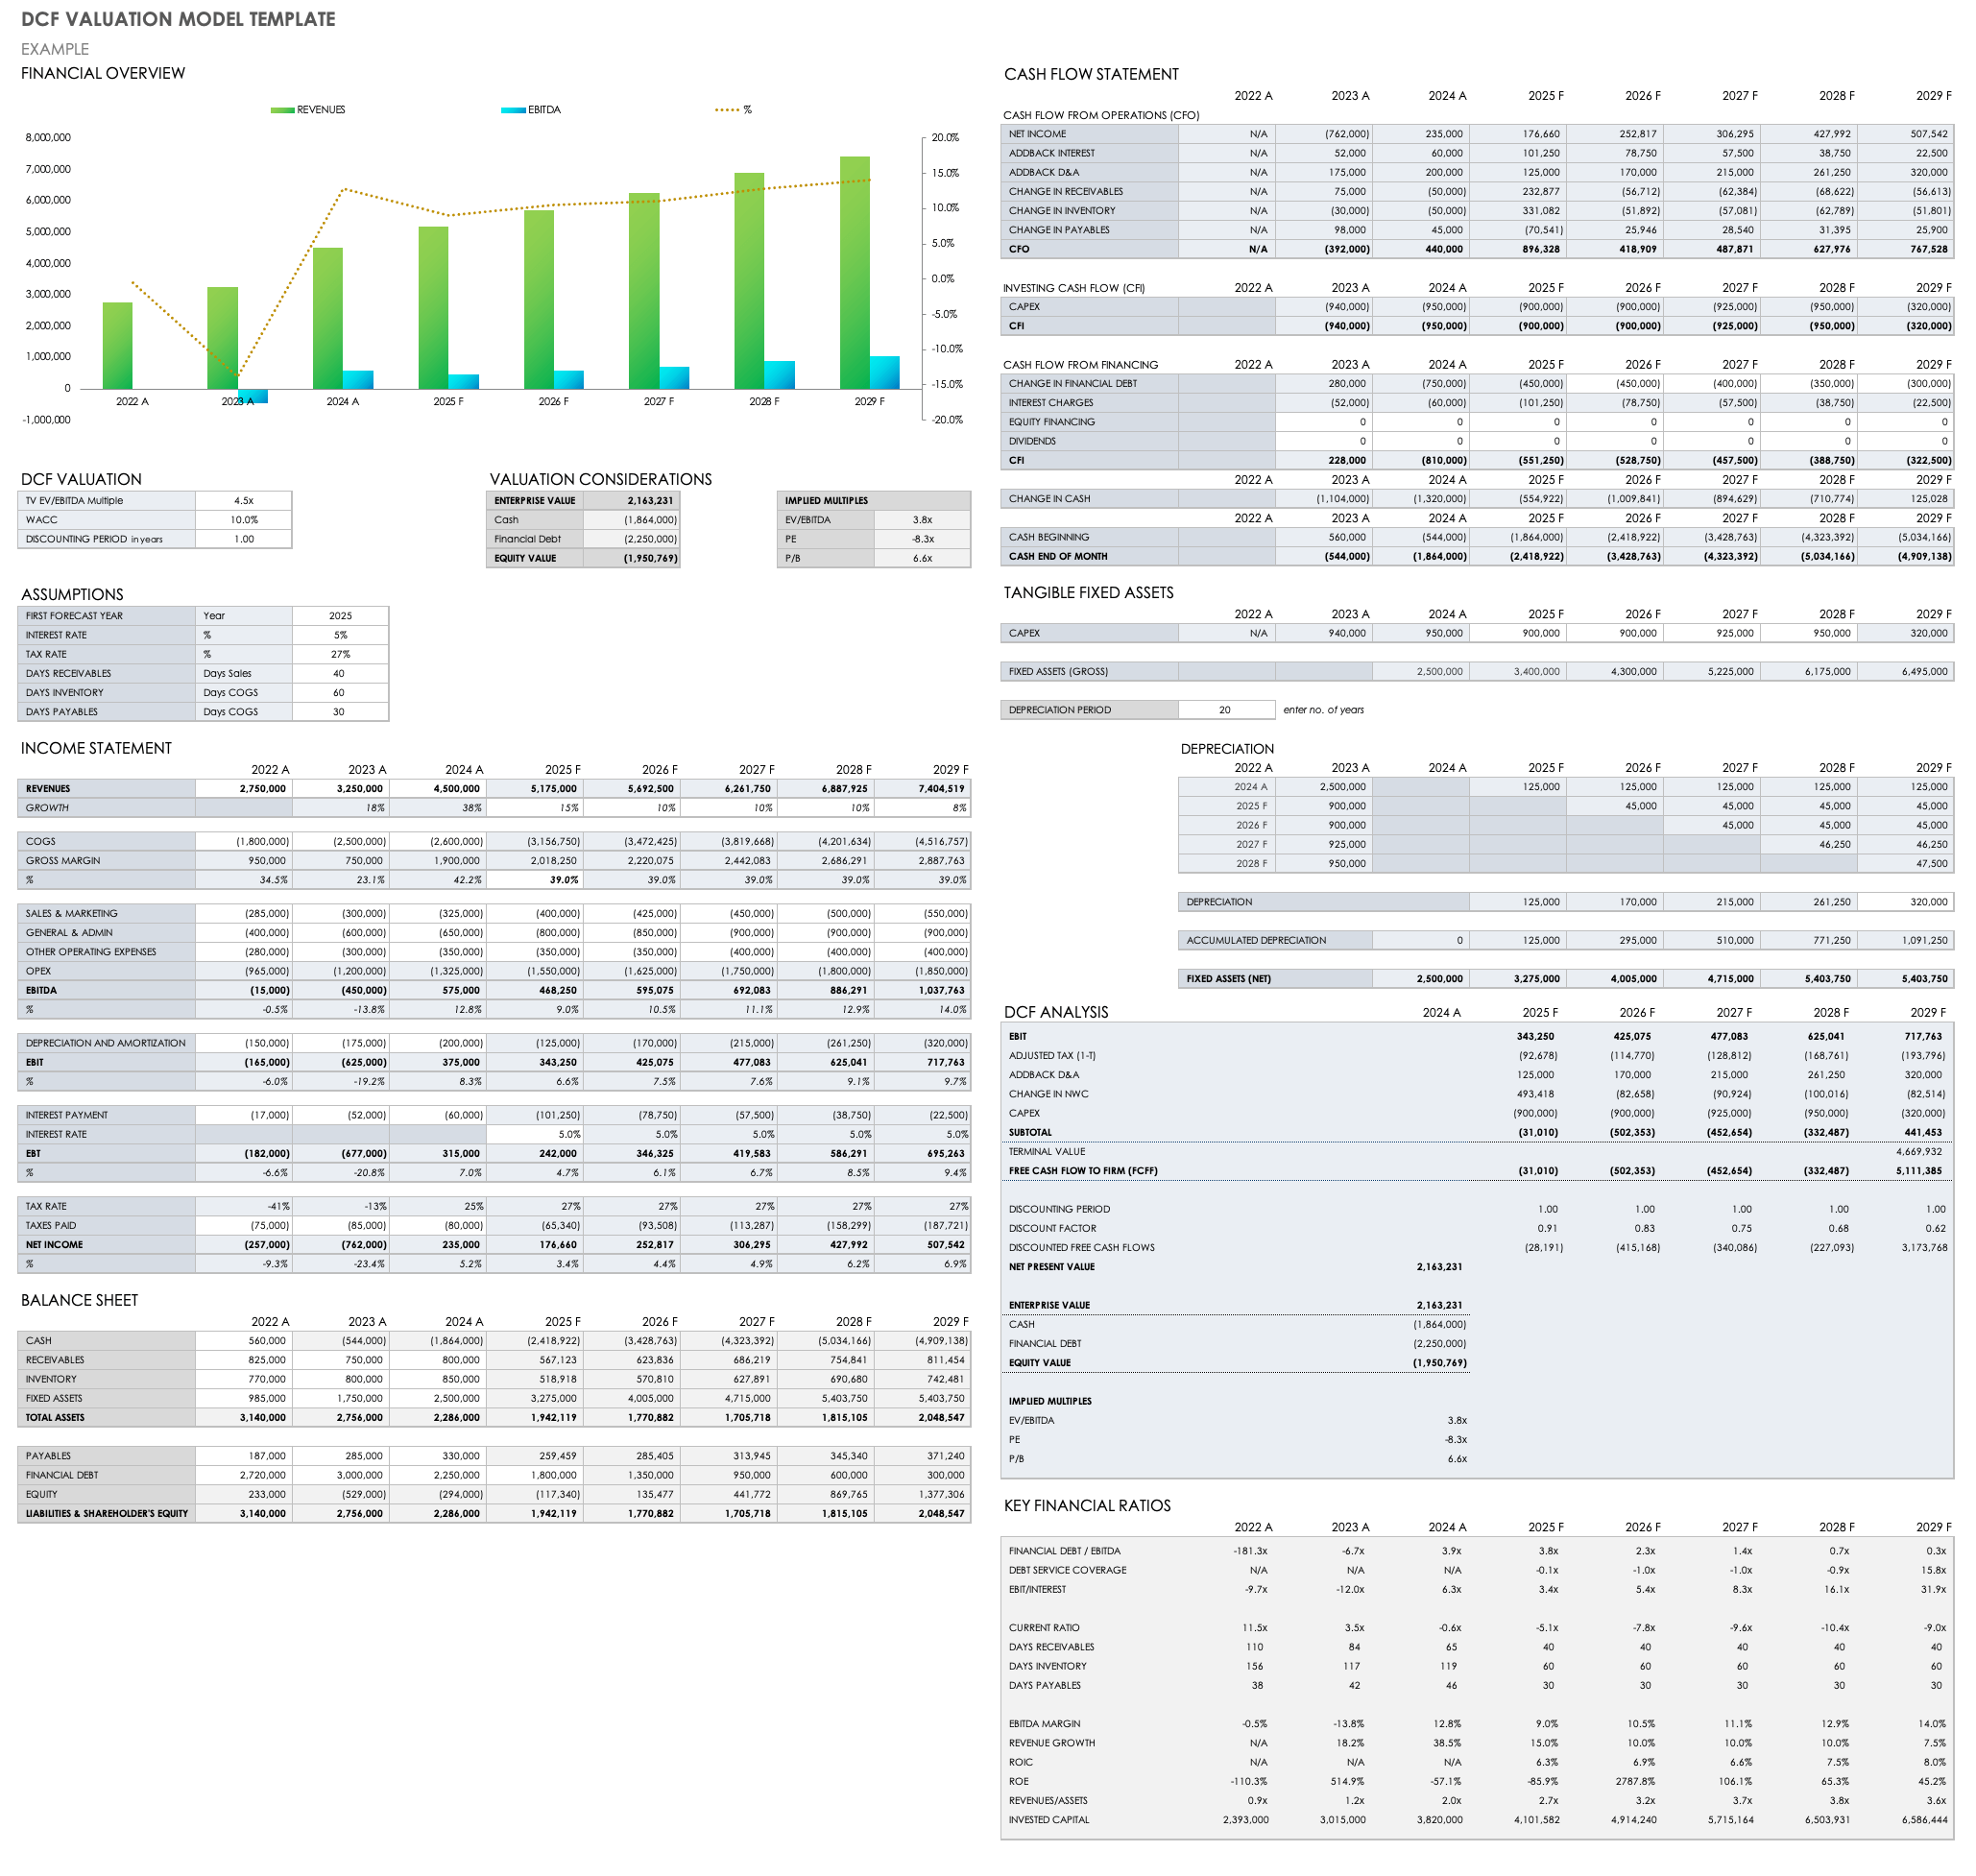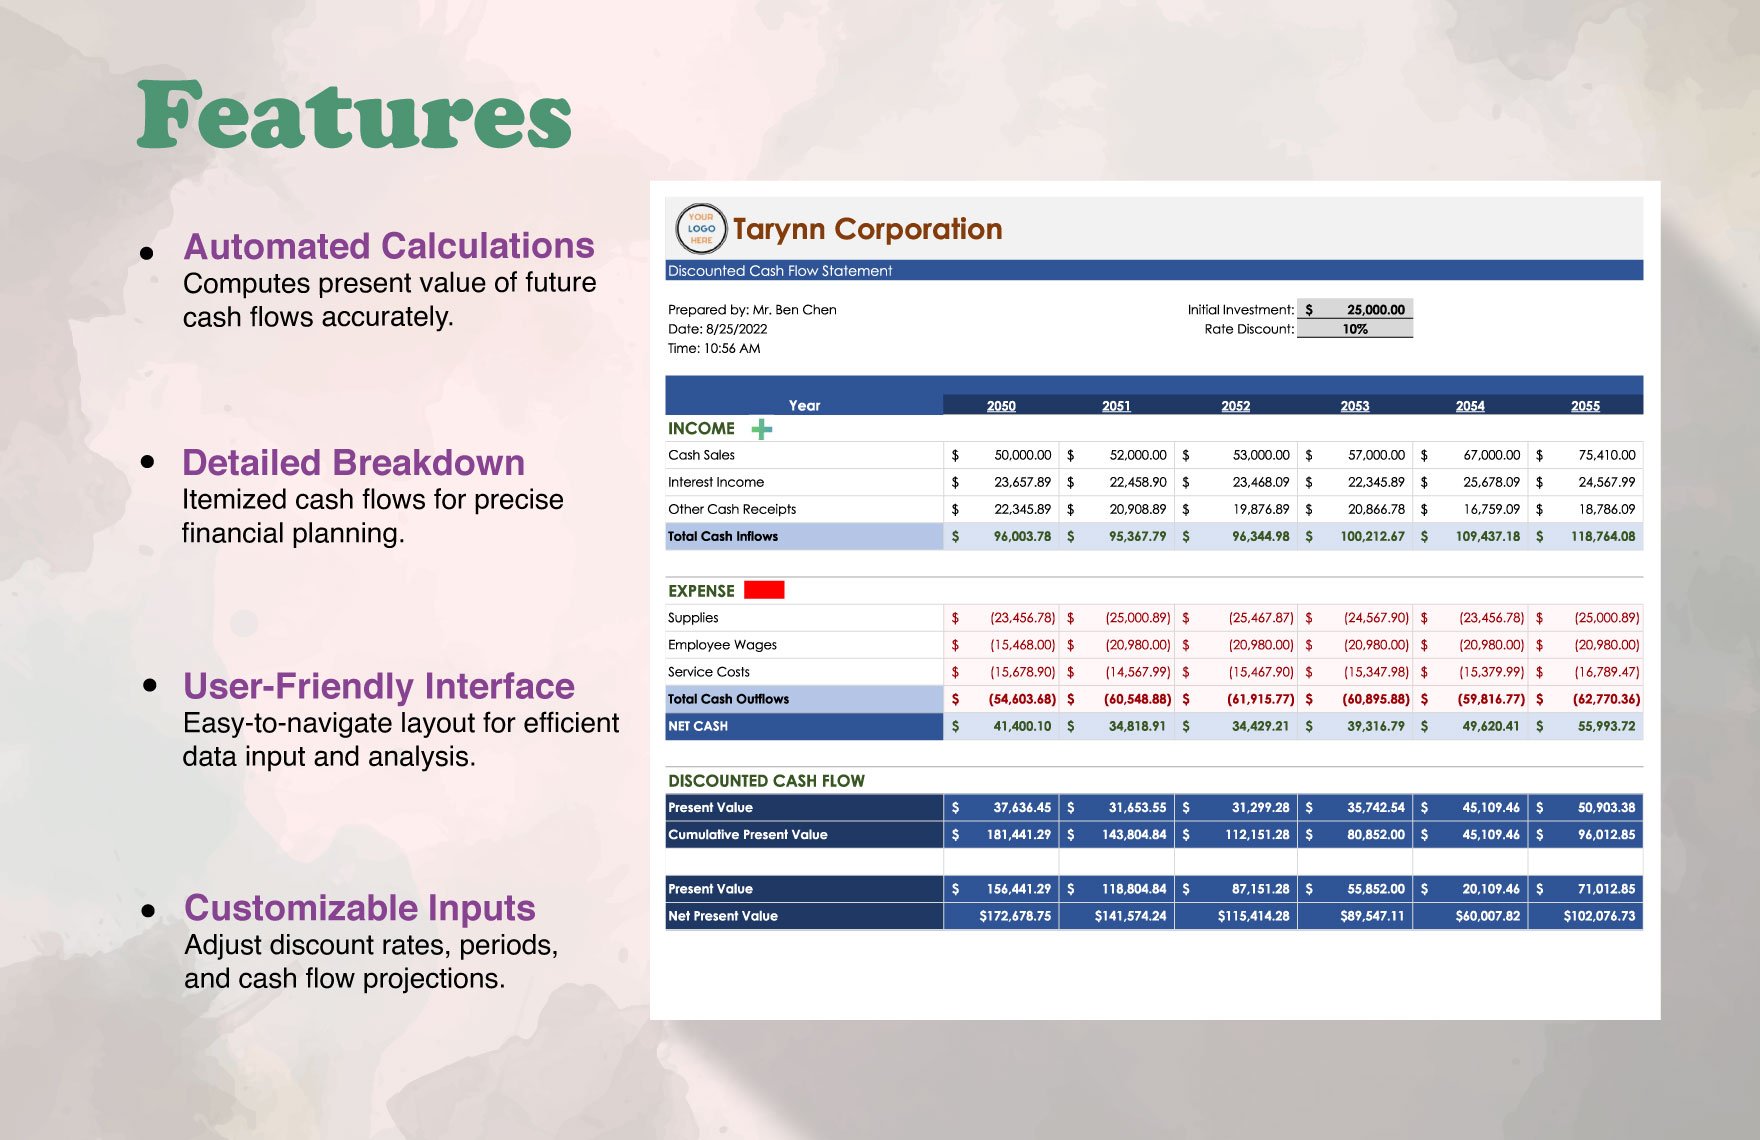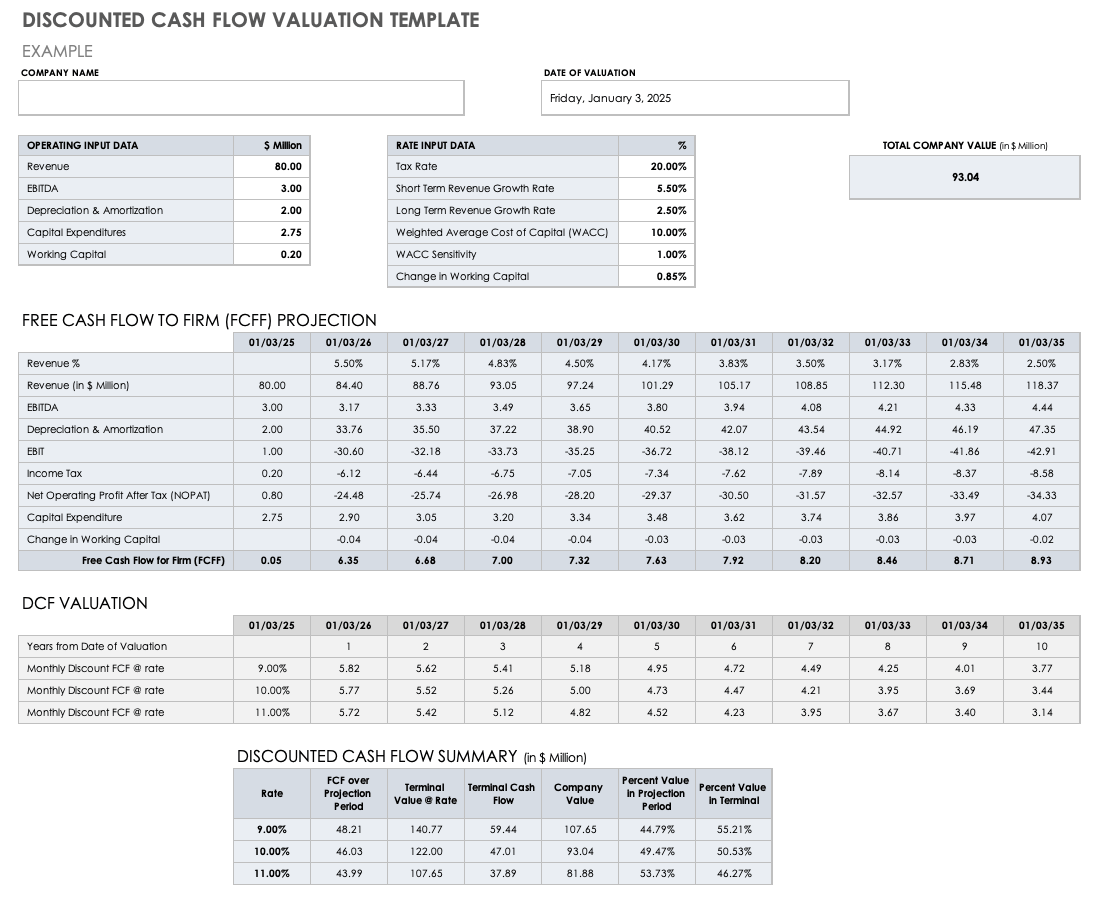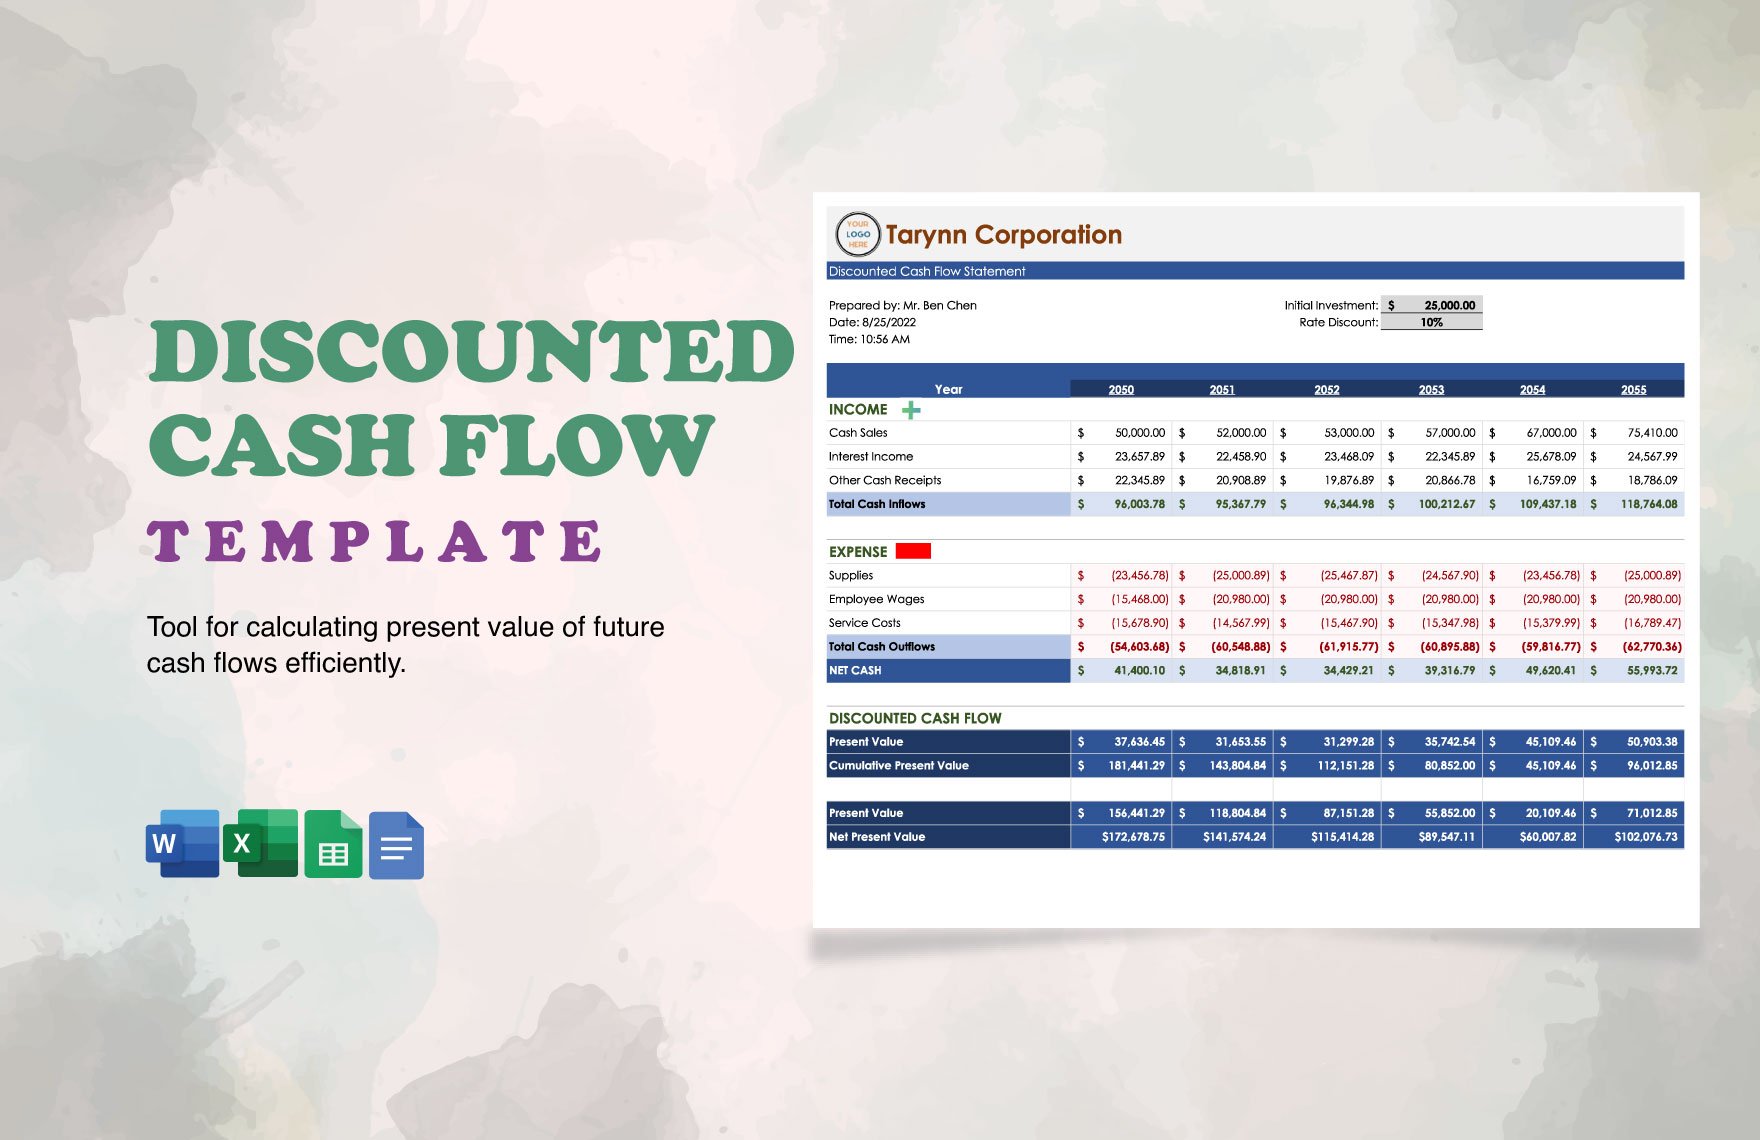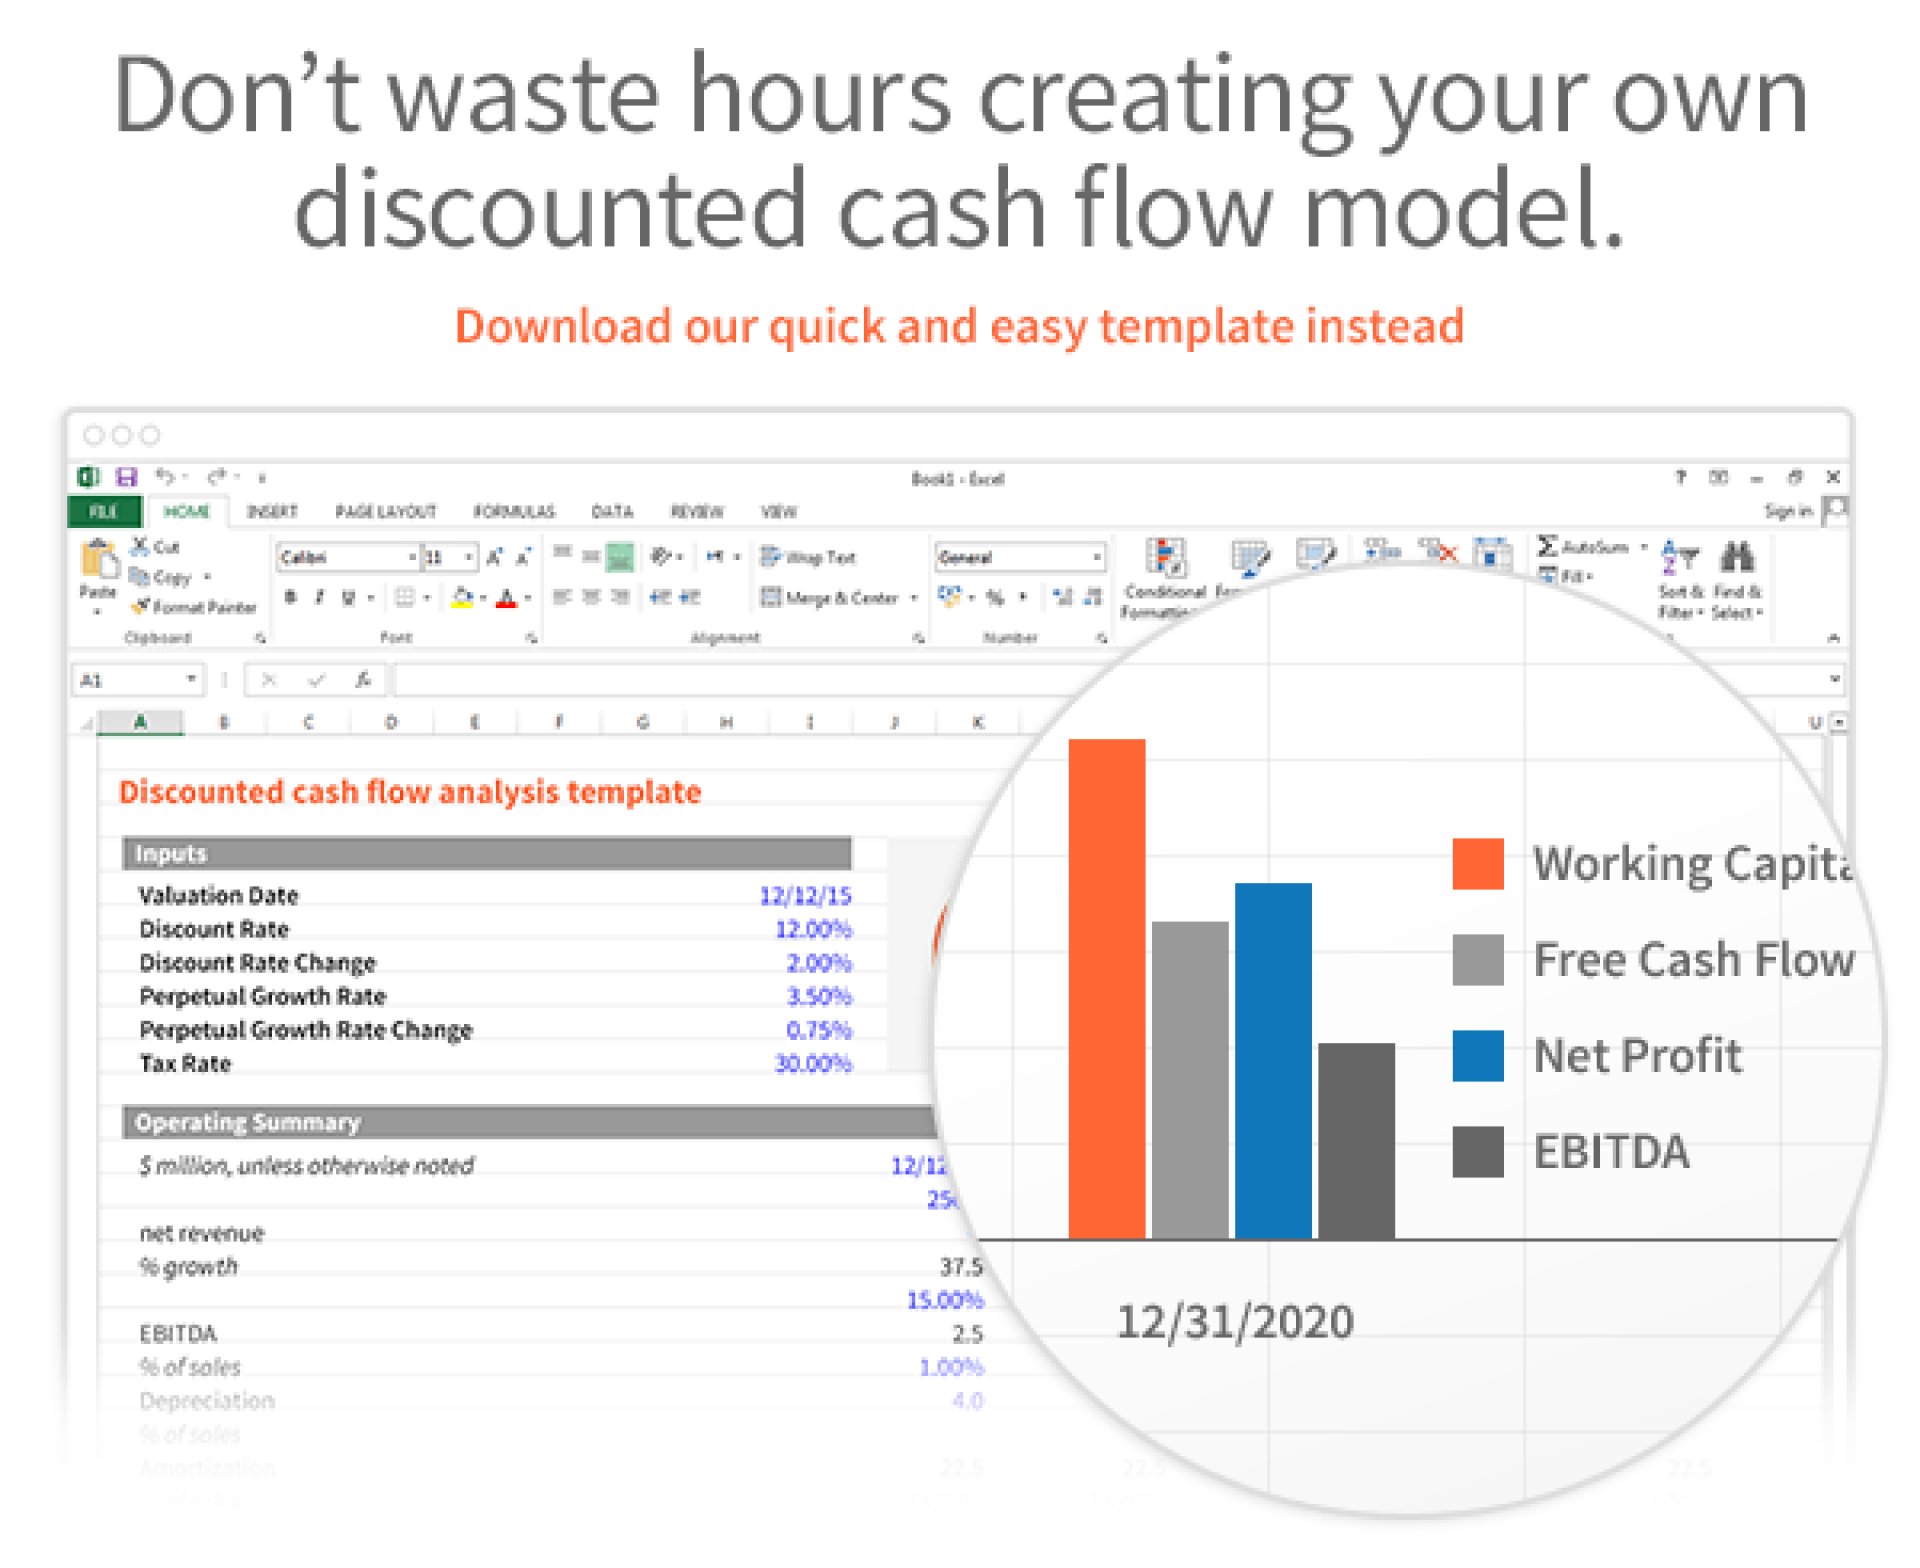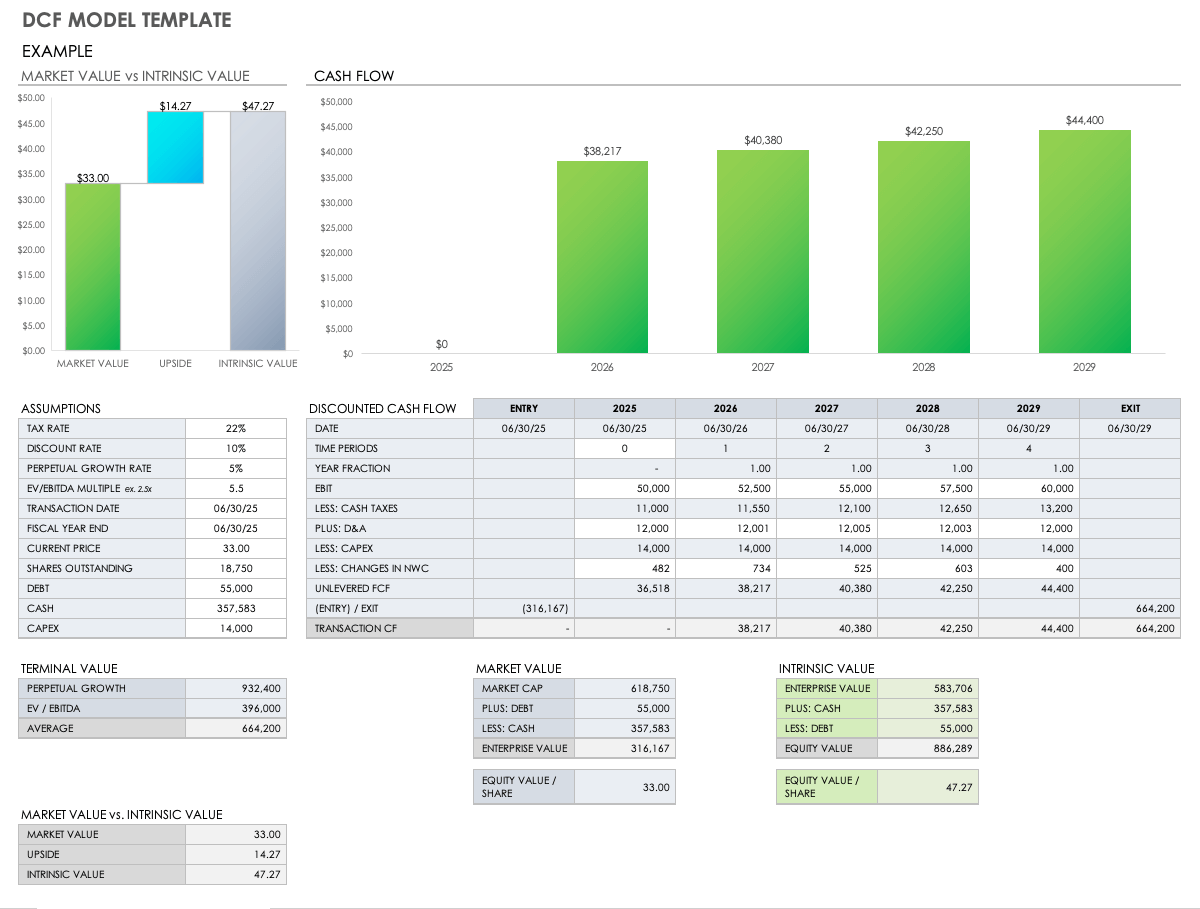
Discounted Cash Flow Analysis Template is the backbone of modern investment analysis, empowering investors, entrepreneurs, and finance professionals to quantify a company’s intrinsic value with precision and clarity. By converting future earnings into today’s dollars, this template bridges the gap between abstract forecasts and tangible decision‑making, making it indispensable for valuation, budgeting, and strategic planning.
What Is a Discounted Cash Flow Analysis Template?
The Core Concept of DCF
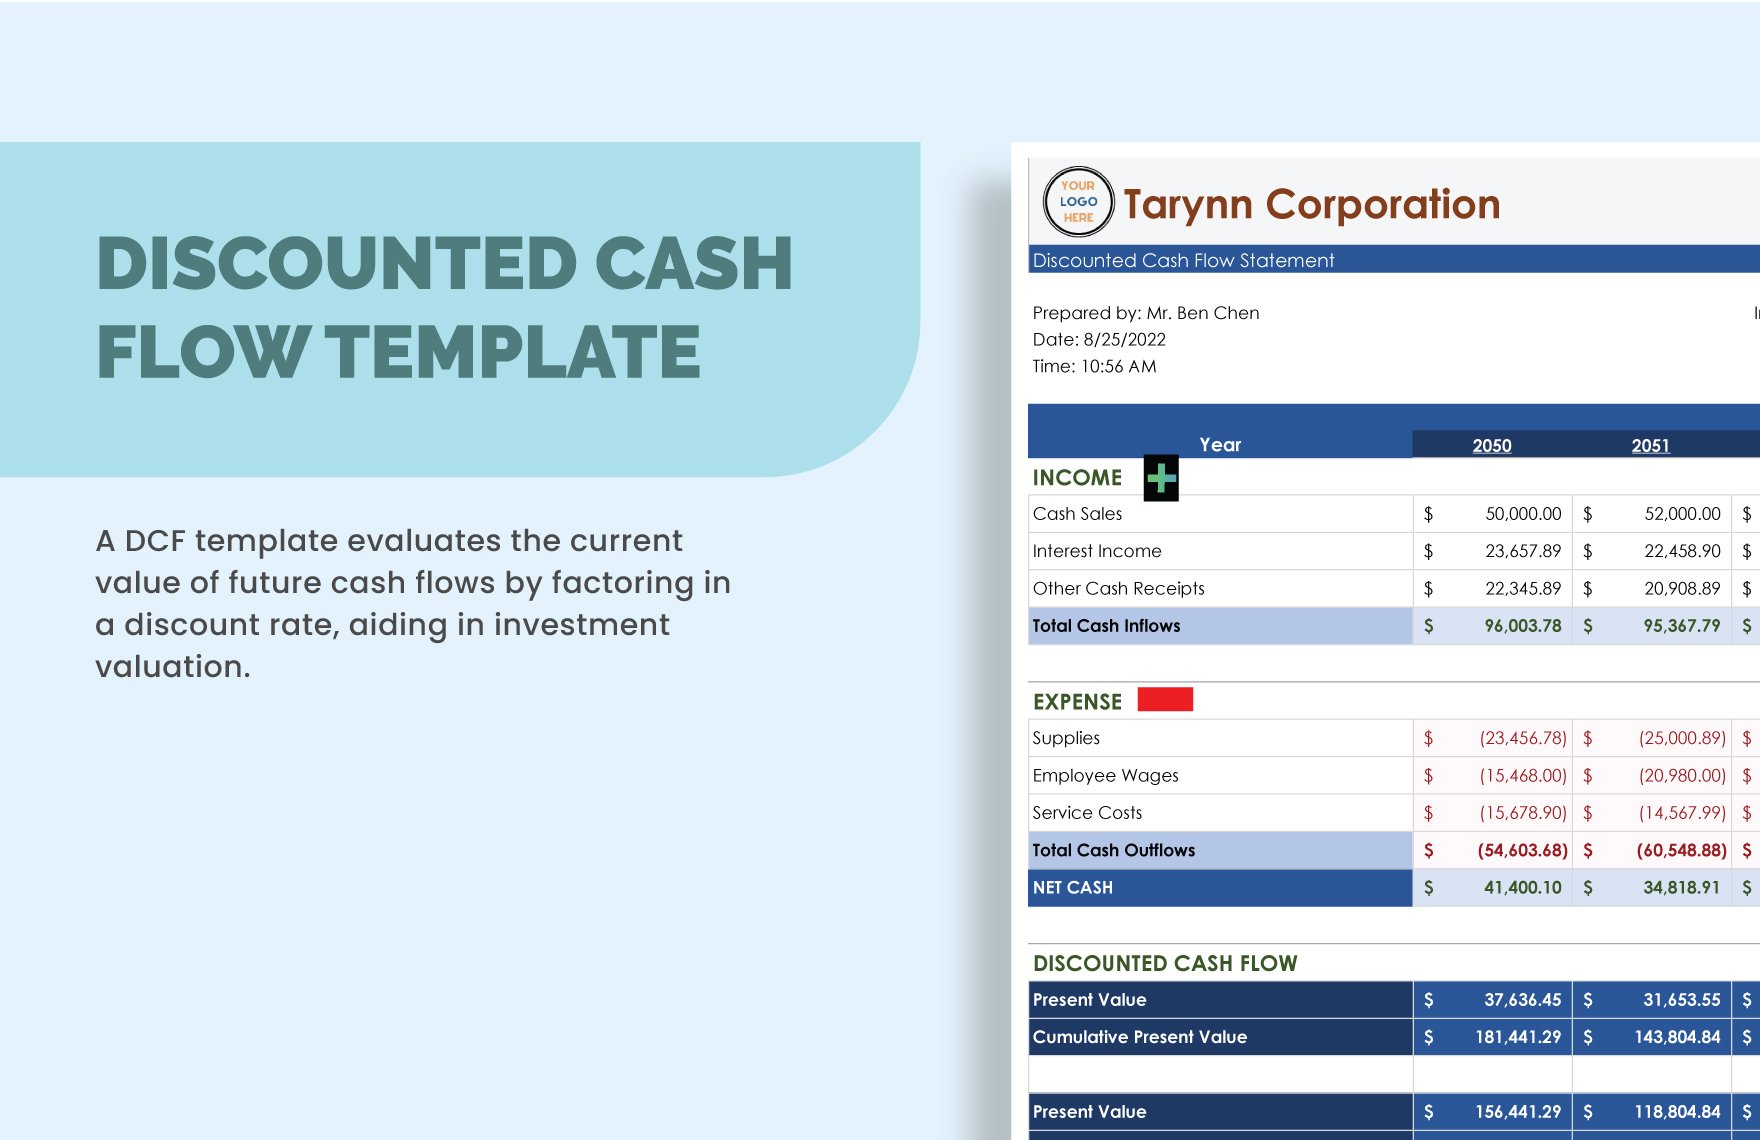
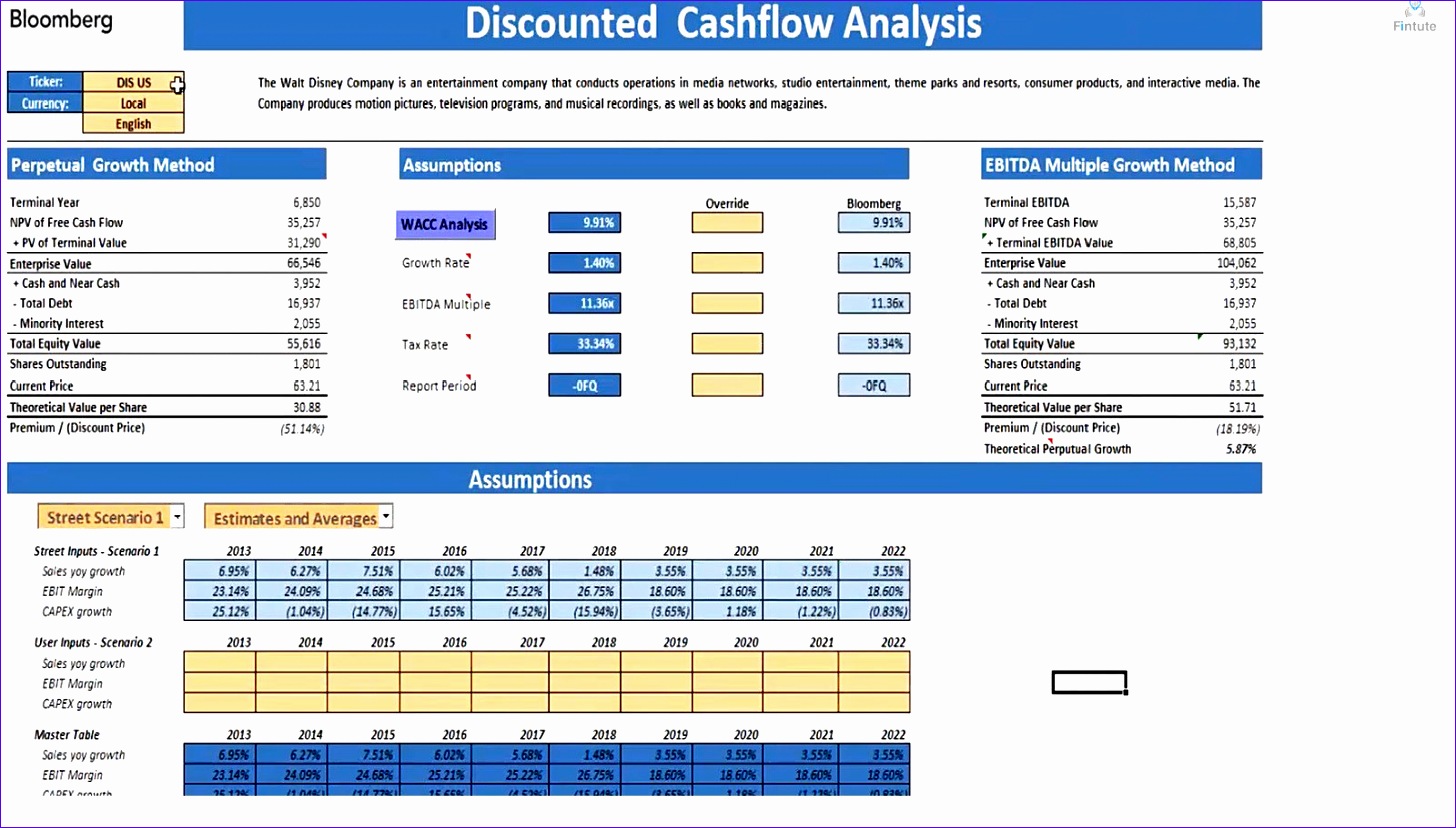
At its heart, a Discounted Cash Flow (DCF) model estimates the present value of a business by projecting its future cash flows and discounting them at an appropriate rate. The discount rate, often the weighted average cost of capital (WACC), reflects the risk and opportunity cost of capital. By summing these discounted cash flows and adding a terminal value, the DCF template delivers a single, actionable figure: the intrinsic worth of the enterprise.
Why Use a Template
Creating a DCF from scratch can be tedious and error‑prone. A pre‑built template streamlines the process, standardizes assumptions, and ensures consistency across analyses. It also makes complex calculations transparent to non‑technical stakeholders, fostering confidence in the valuation. Whether you’re a seasoned analyst or a small business owner, a robust DCF template elevates the quality and credibility of your financial insights.
Key Components of a DCF Template
Revenue Projections
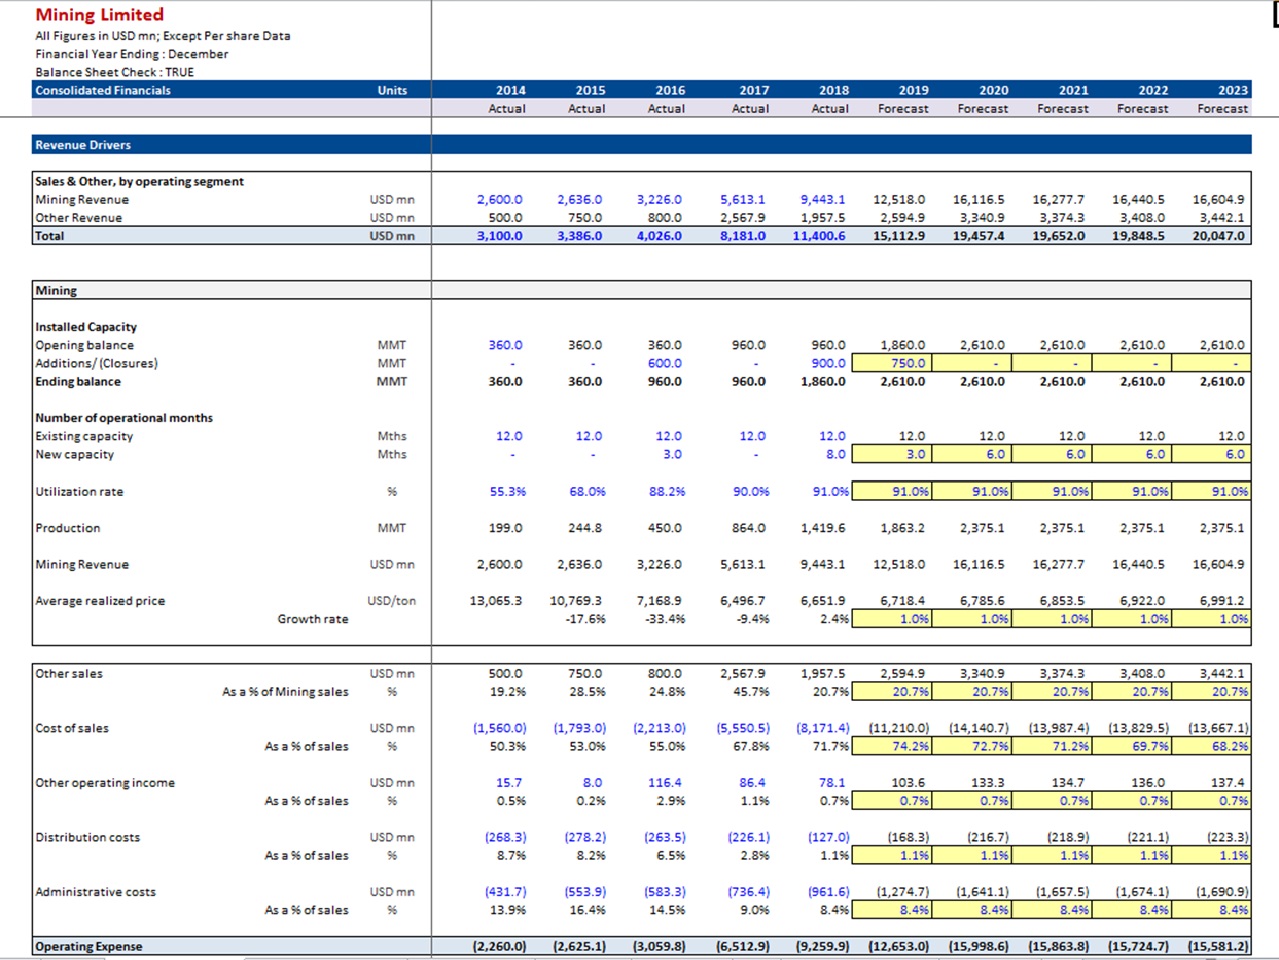
Revenue forecasting is the foundation of any DCF. Begin with historical sales data and adjust for growth drivers such as market expansion, product launches, or seasonal trends. Include a revenue breakdown by segment if the company has multiple lines of business, and clearly label assumptions to aid review.
Operating Expenses
Operating expenses should mirror the structure of your income statement: cost of goods sold, selling, general & administrative expenses, and research & development. Track each line item separately and base future values on historical ratios or industry benchmarks. Maintaining a detailed expense table keeps the model flexible for scenario testing.
Capital Expenditures
CapEx is critical because it represents cash outflows that support growth. Capture planned investments in property, plant, equipment, and intangible assets. If the company follows a steady‑state investment pattern, simply use a % of revenue or a fixed amount; otherwise, model each project’s timing and magnitude.
Working Capital Changes
Changes in working capital—accounts receivable, inventory, and accounts payable—impact free cash flow. Calculate the net working capital adjustment as a percentage of revenue, or model each component individually. Ignoring working capital can skew results, especially for cyclical businesses.
Discount Rate and Terminal Value
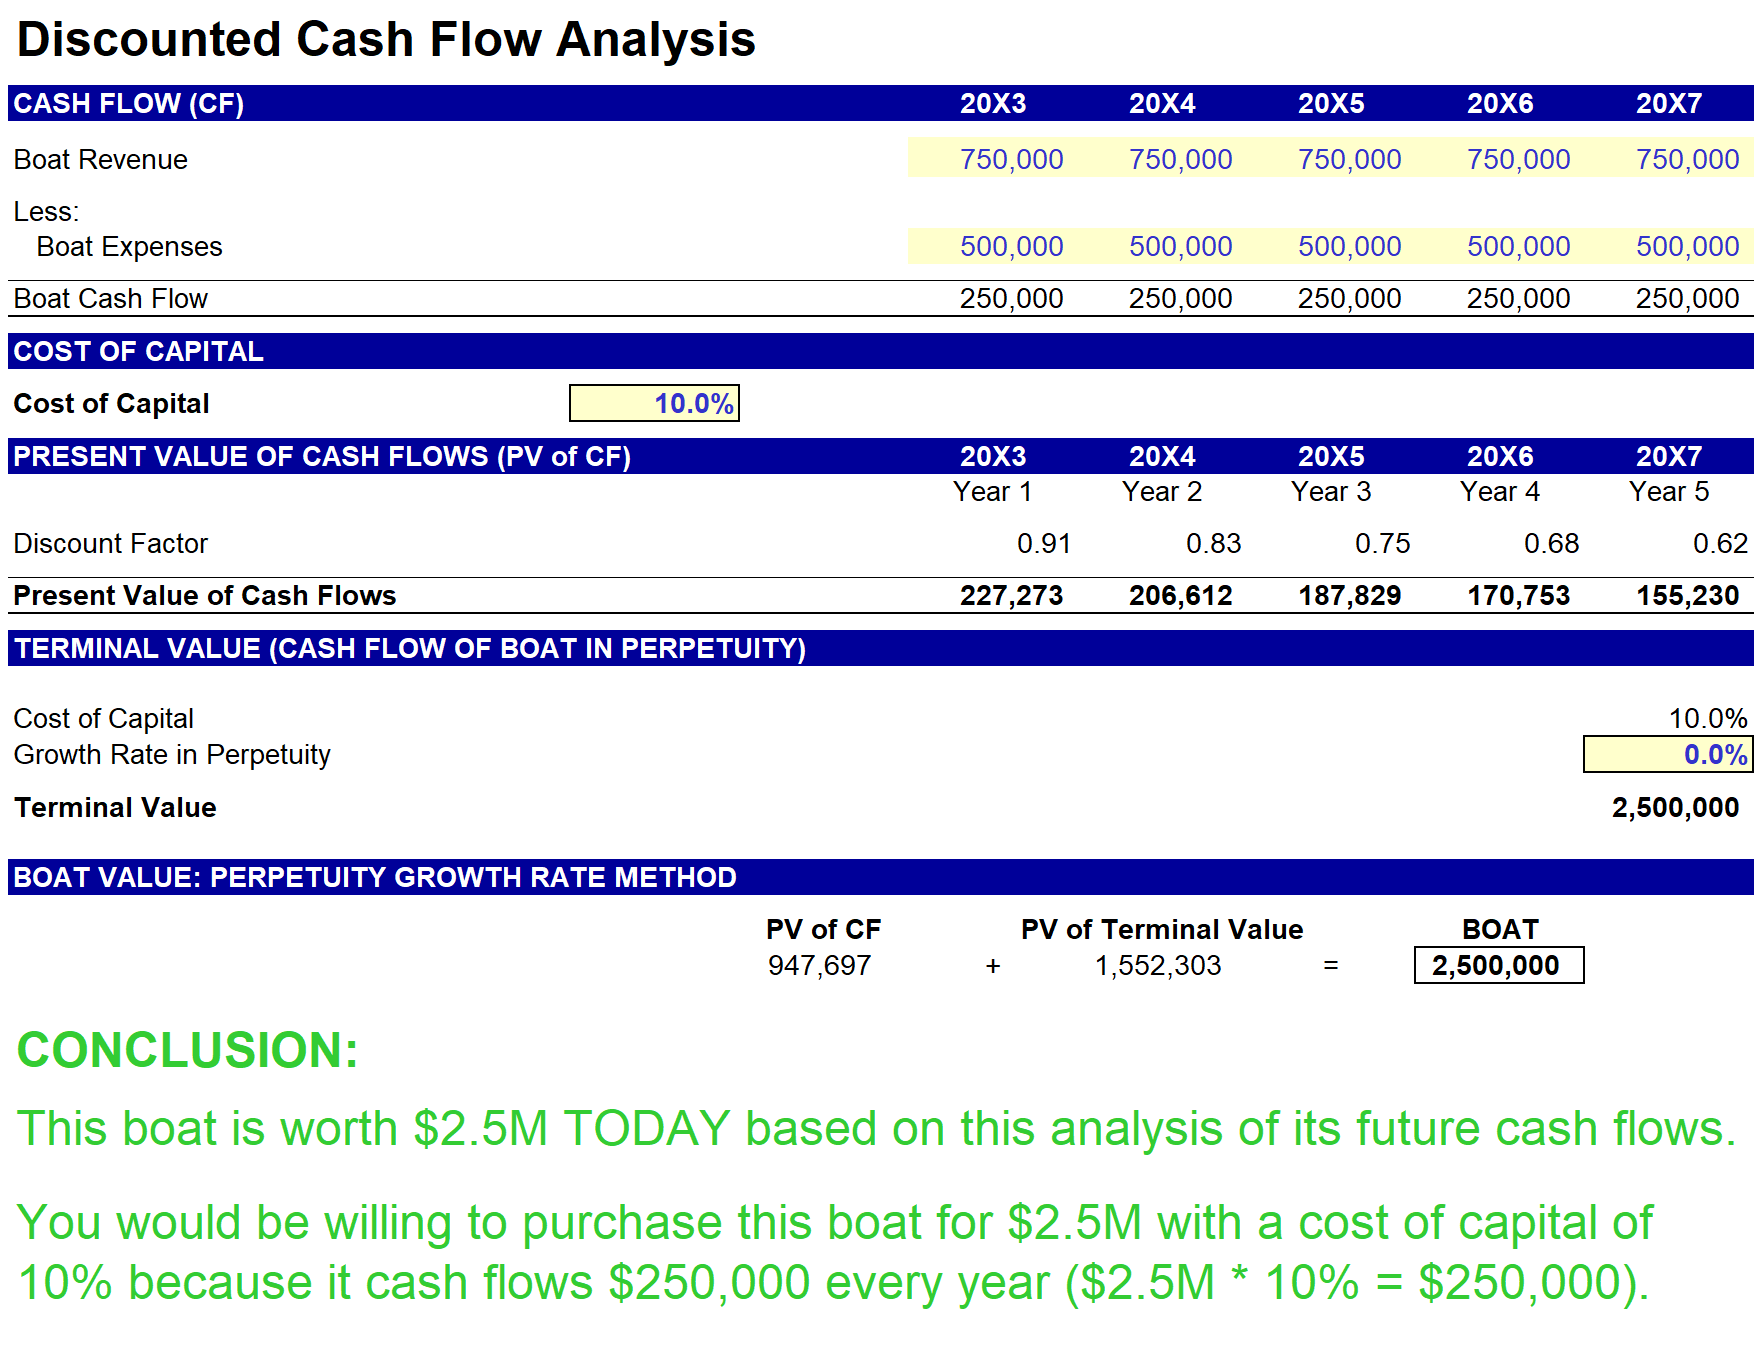
The discount rate encapsulates the opportunity cost of capital and the risk profile. A typical WACC calculation balances debt and equity costs, adjusting for tax shields and capital structure. Terminal value captures all cash flows beyond the explicit forecast horizon, often using a perpetuity growth model or an exit multiple approach.
Step‑by‑Step Guide to Building and Using Your Template

Step 1 – Gather Historical Data
Start by importing at least five years of audited financial statements. Verify consistency in accounting policies, normalize one‑off items, and calculate key ratios such as EBITDA margin, debt‑to‑EBITDA, and capital intensity. These ratios inform your baseline assumptions.
Step 2 – Forecast Cash Flows
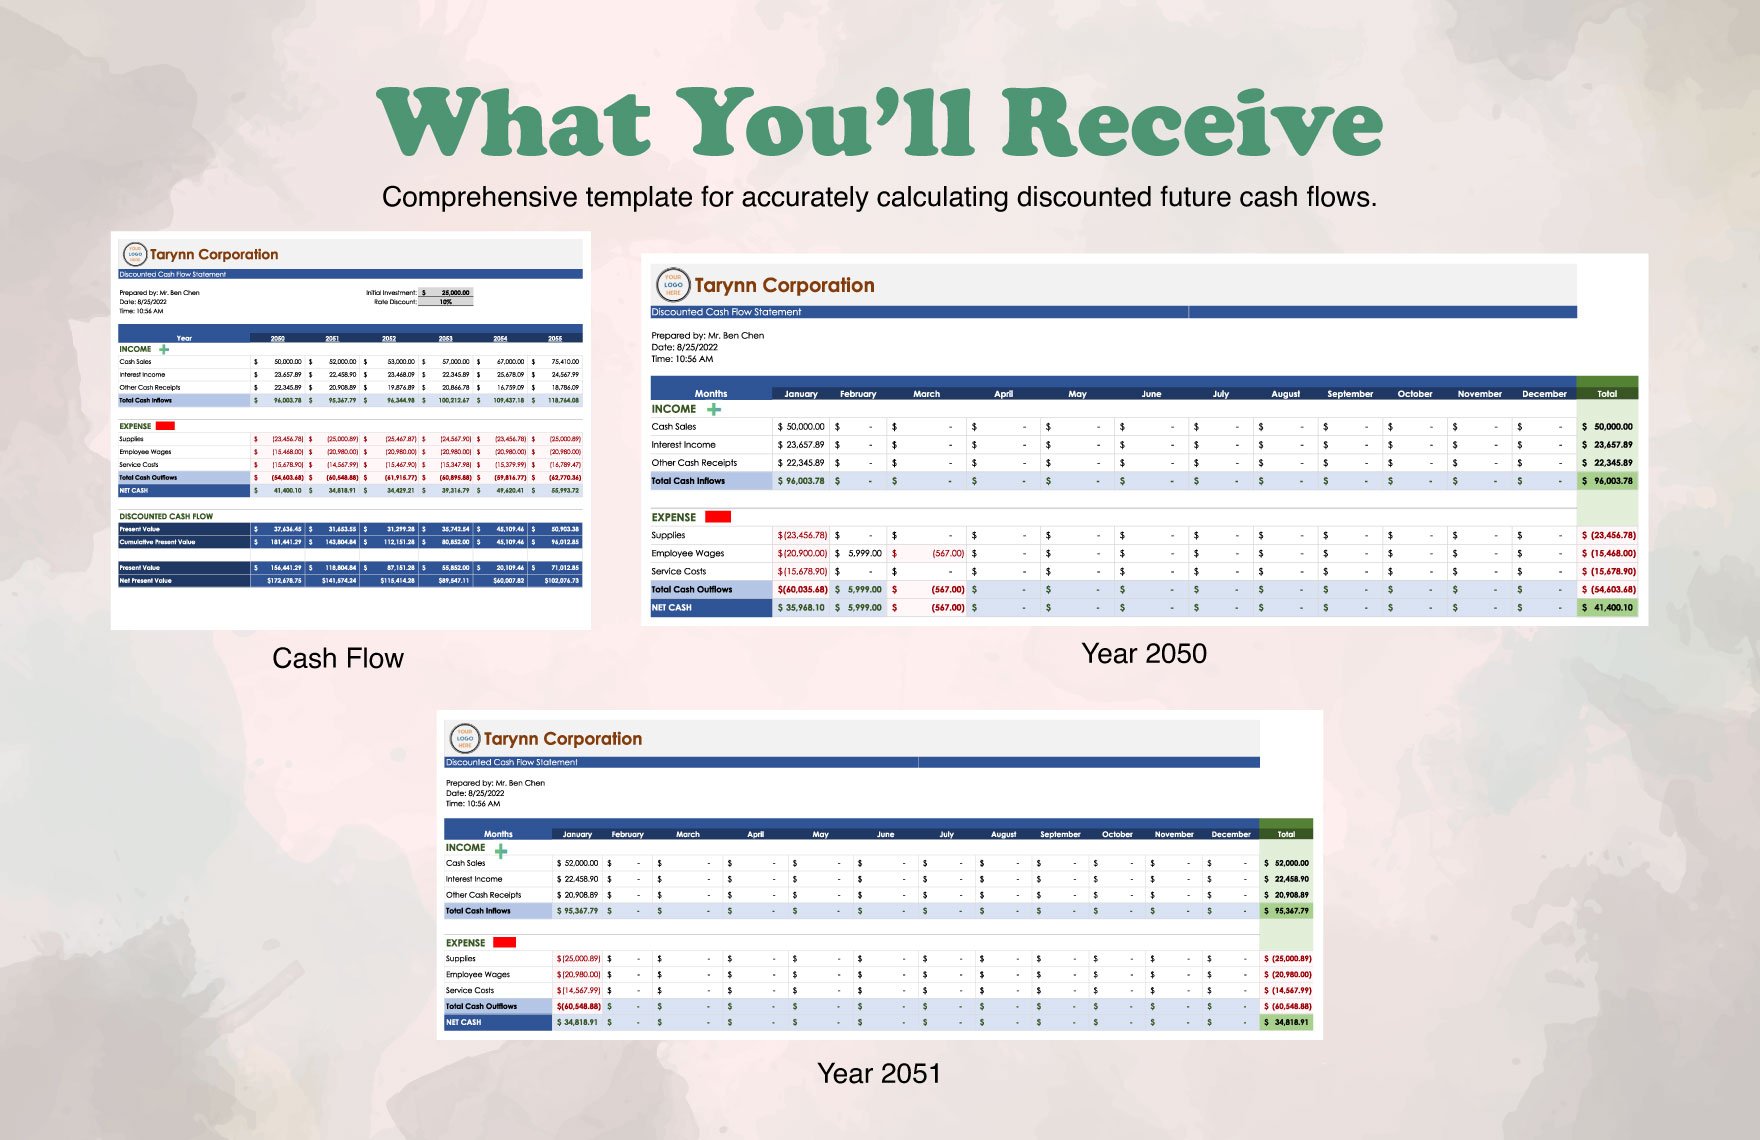
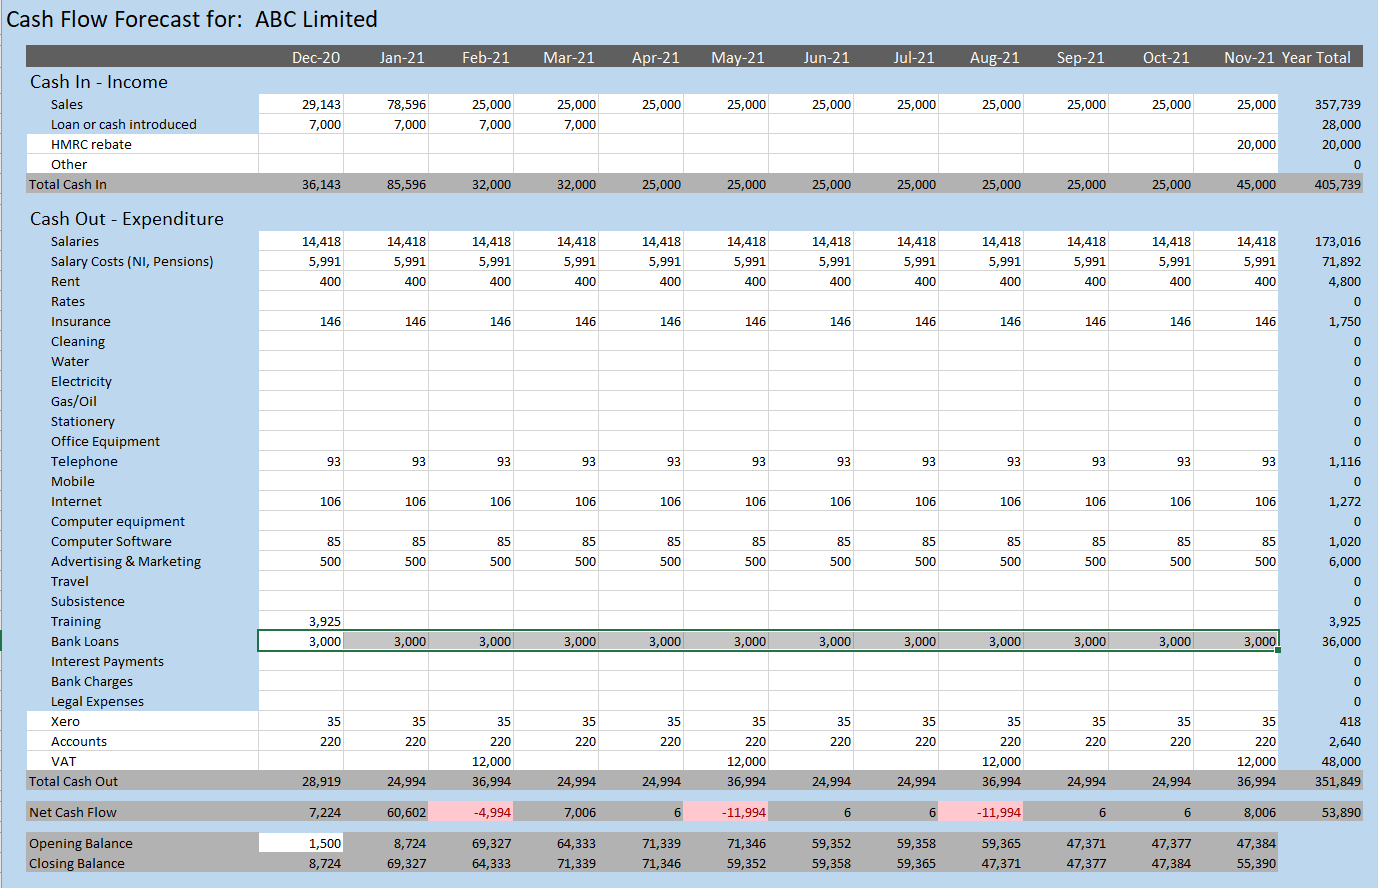
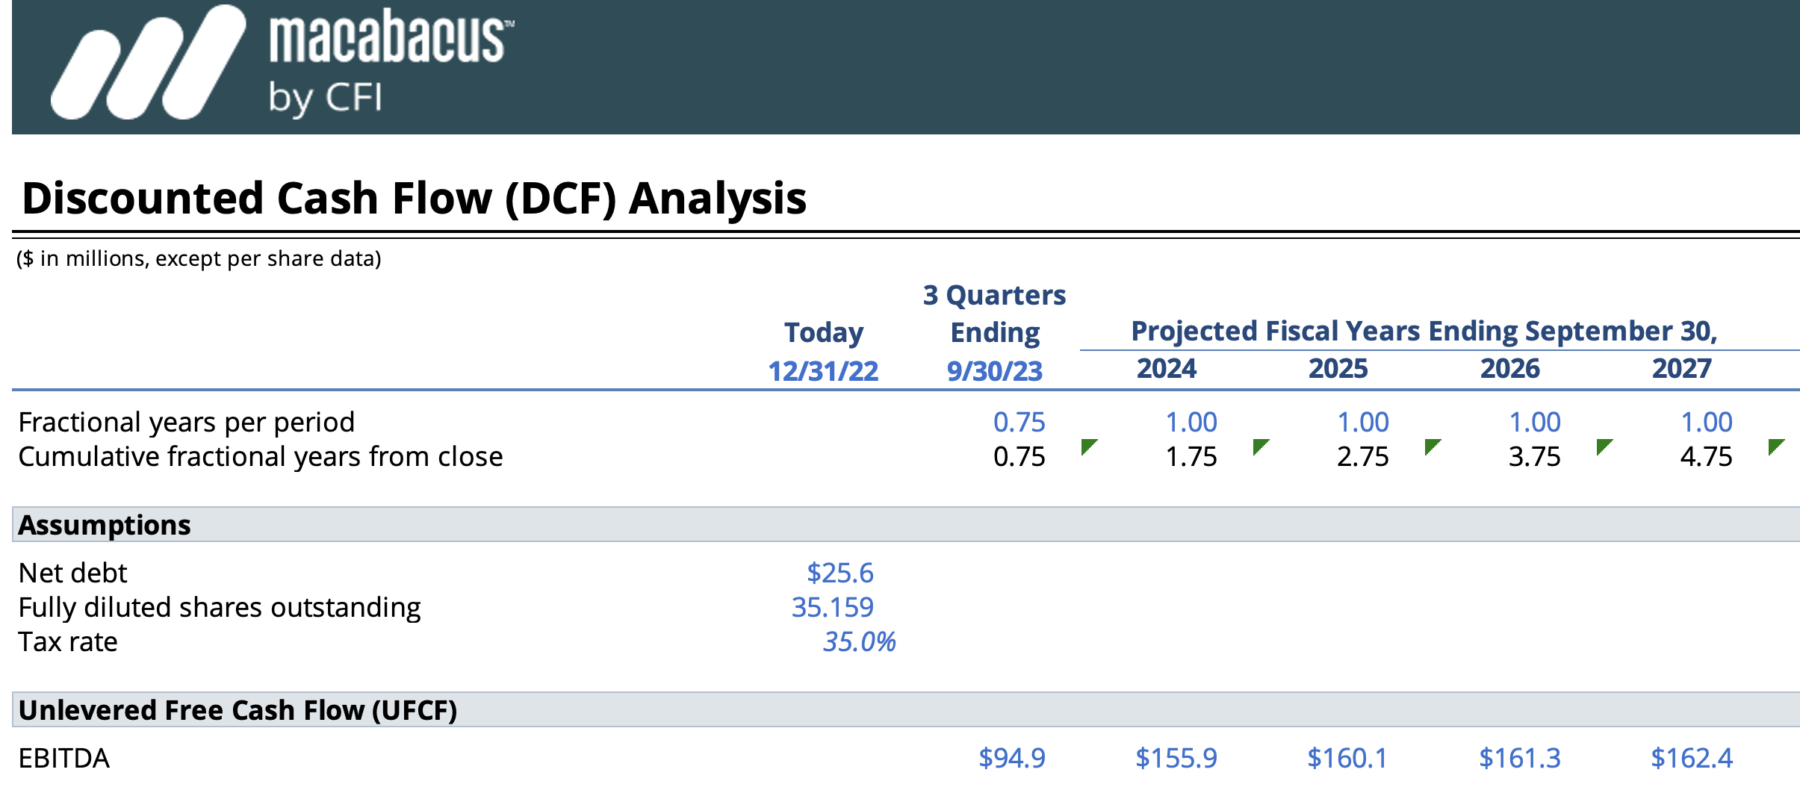
Extend your projections out 5–10 years, aligning revenue growth, margin trends, CapEx, and working capital with realistic business milestones. Use a waterfall structure: start with revenue, subtract operating expenses, add depreciation and amortization, adjust for tax, and subtract CapEx and working capital changes to arrive at free cash flow.
Step 3 – Determine the Discount Rate
Calculate the cost of equity using the Capital Asset Pricing Model (CAPM) and the cost of debt via the after‑tax yield on outstanding debt. Blend these costs weighted by their proportion in the capital structure. Double‑check that the resulting WACC aligns with industry norms; an outlier often signals data errors.
Step 4 – Calculate Present Value
Discount each projected free cash flow back to the present using the WACC. Sum the discounted cash flows and add the discounted terminal value to produce the enterprise value. Divide by shares outstanding to derive an intrinsic per‑share value, providing a benchmark for equity investors.
Step 5 – Sensitivity Analysis
Perform a sensitivity matrix by varying key assumptions—growth rate, margin, WACC, and terminal growth—within realistic ranges. A two‑by‑two table or a tornado diagram helps illustrate how changes impact valuation, offering a clear risk profile for stakeholders.
Real‑World Examples
Example 1 – Small Business Valuation
Imagine a family‑owned restaurant with steady cash flow and limited growth prospects. Using a DCF template, you project a 2% annual revenue growth, maintain a 20% operating margin, and factor in modest CapEx for equipment upgrades. A WACC of 8% reflects the low risk profile. The resulting valuation might yield a modest premium over the market price, suggesting a fair purchase price for an acquisition.
Example 2 – Tech Startup with Rapid Growth
A SaaS startup is poised to expand into new markets. Forecasting includes a 30% revenue CAGR, a tightening EBITDA margin from 10% to 25% over five years, significant early CapEx for data centers, and a high WACC of 15% due to venture risk. By incorporating scenario analysis—best, base, and worst case—you can demonstrate the upside potential while highlighting sensitivity to churn rates and pricing strategy.
Common Pitfalls and How to Avoid Them
Overly Optimistic Forecasts
Excessive optimism inflates valuation. Counter this by benchmarking against industry peers, using conservative growth rates, and validating assumptions with customer interviews or market research.
Misapplying the Discount Rate
Using an inappropriate WACC—such as applying a corporate WACC to a small business—distorts the present value. Always calculate a company‑specific WACC that reflects its debt structure, tax situation, and risk profile.
Ignoring Terminal Growth Assumptions
A terminal value that grows at an unsustainable rate (e.g., 10% in a mature market) overestimates the valuation. Align terminal growth with long‑term GDP growth or industry averages to maintain realism.
Customizing the Template for Your Needs
Adjusting for Industry Nuances
Different sectors require tailored assumptions: manufacturing may emphasize depreciation schedules; retail may need detailed inventory turnover ratios; real estate might focus on rental income and property appreciation. Embed industry‑specific parameters into the template’s input section.
Using Excel vs. Google Sheets
Excel offers advanced functions like Solver and Scenario Manager, ideal for complex models. Google Sheets provides real‑time collaboration and cloud accessibility, making it convenient for remote teams. Choose the platform that aligns with your workflow.
Adding Scenario Tables
Incorporate a built‑in scenario table that automatically recalculates valuation under different growth, margin, and cost of capital assumptions. This feature enables quick “what‑if” analysis and supports executive presentations.
Tips for Presenting DCF Results to Stakeholders
Visualizing with Charts
Graphs that depict projected cash flows, cumulative discounted values, and sensitivity ranges translate numbers into intuitive visuals. A simple line chart showing forecast vs. actual can illustrate model accuracy and build credibility.
Crafting a Clear Narrative
Begin with the key assumptions, explain the discount logic, and walk through the valuation outcome. Conclude with the implications for investment decisions, risk mitigation, and strategic actions. A cohesive story keeps audiences engaged and informed.
Conclusion
Mastering a Discounted Cash Flow Analysis Template equips you to evaluate businesses with analytical rigor, communicate findings confidently, and uncover hidden value. From assembling reliable data to fine‑tuning assumptions and presenting insights persuasively, each step reinforces the model’s credibility. Whether you’re pricing an acquisition, pitching a startup, or managing a portfolio, this template is your gateway to informed, data‑driven decision making. By avoiding common pitfalls, customizing for industry realities, and embracing robust sensitivity testing, you turn raw numbers into a powerful narrative that drives strategy and unlocks value.