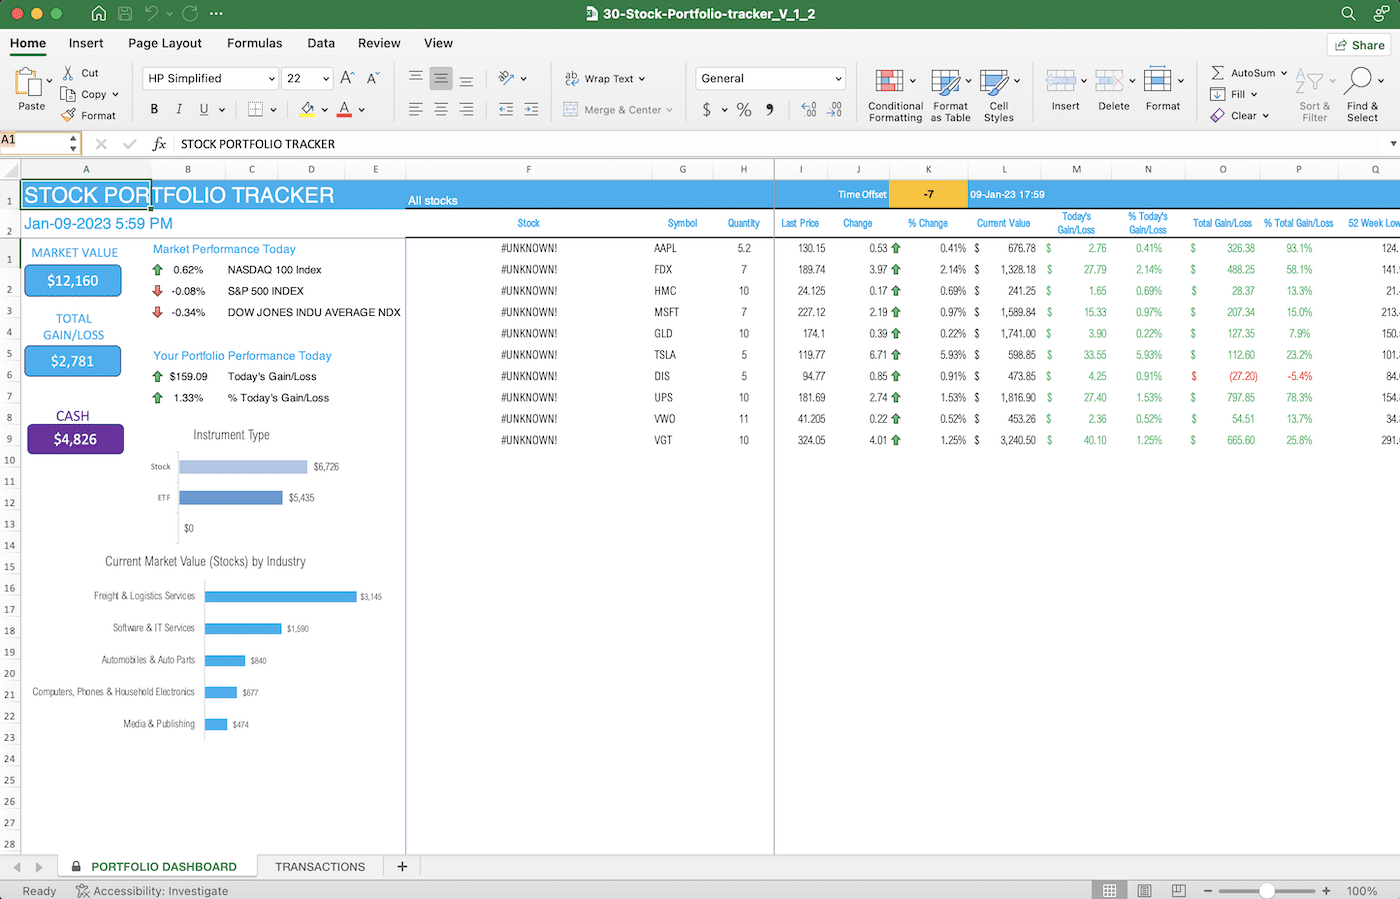
Excel Template For Stock Analysis has become an essential tool for investors who want to blend rigorous data handling with the flexibility of a familiar spreadsheet environment, and this article will show you exactly why and how to leverage it for superior decision‑making.
Why Use an Excel Template for Stock Analysis
Excel remains the most widely adopted platform for financial modeling because it offers real‑time calculation, powerful charting, and limitless customization without the need for expensive software licenses. When you employ a dedicated template, you standardize your workflow, reduce manual entry errors, and create a repeatable process that can be refined over time. Moreover, a well‑structured template facilitates quick comparison across multiple securities, enabling you to spot trends, evaluate valuation metrics, and assess risk factors at a glance. The result is a faster, more disciplined investment analysis that aligns with professional standards while remaining accessible to individual traders.
Key Components of an Effective Stock Analysis Template

A robust template is built around several core modules that capture both quantitative data and qualitative insights. Below are the essential components every serious investor should include.
Data Input Sheet
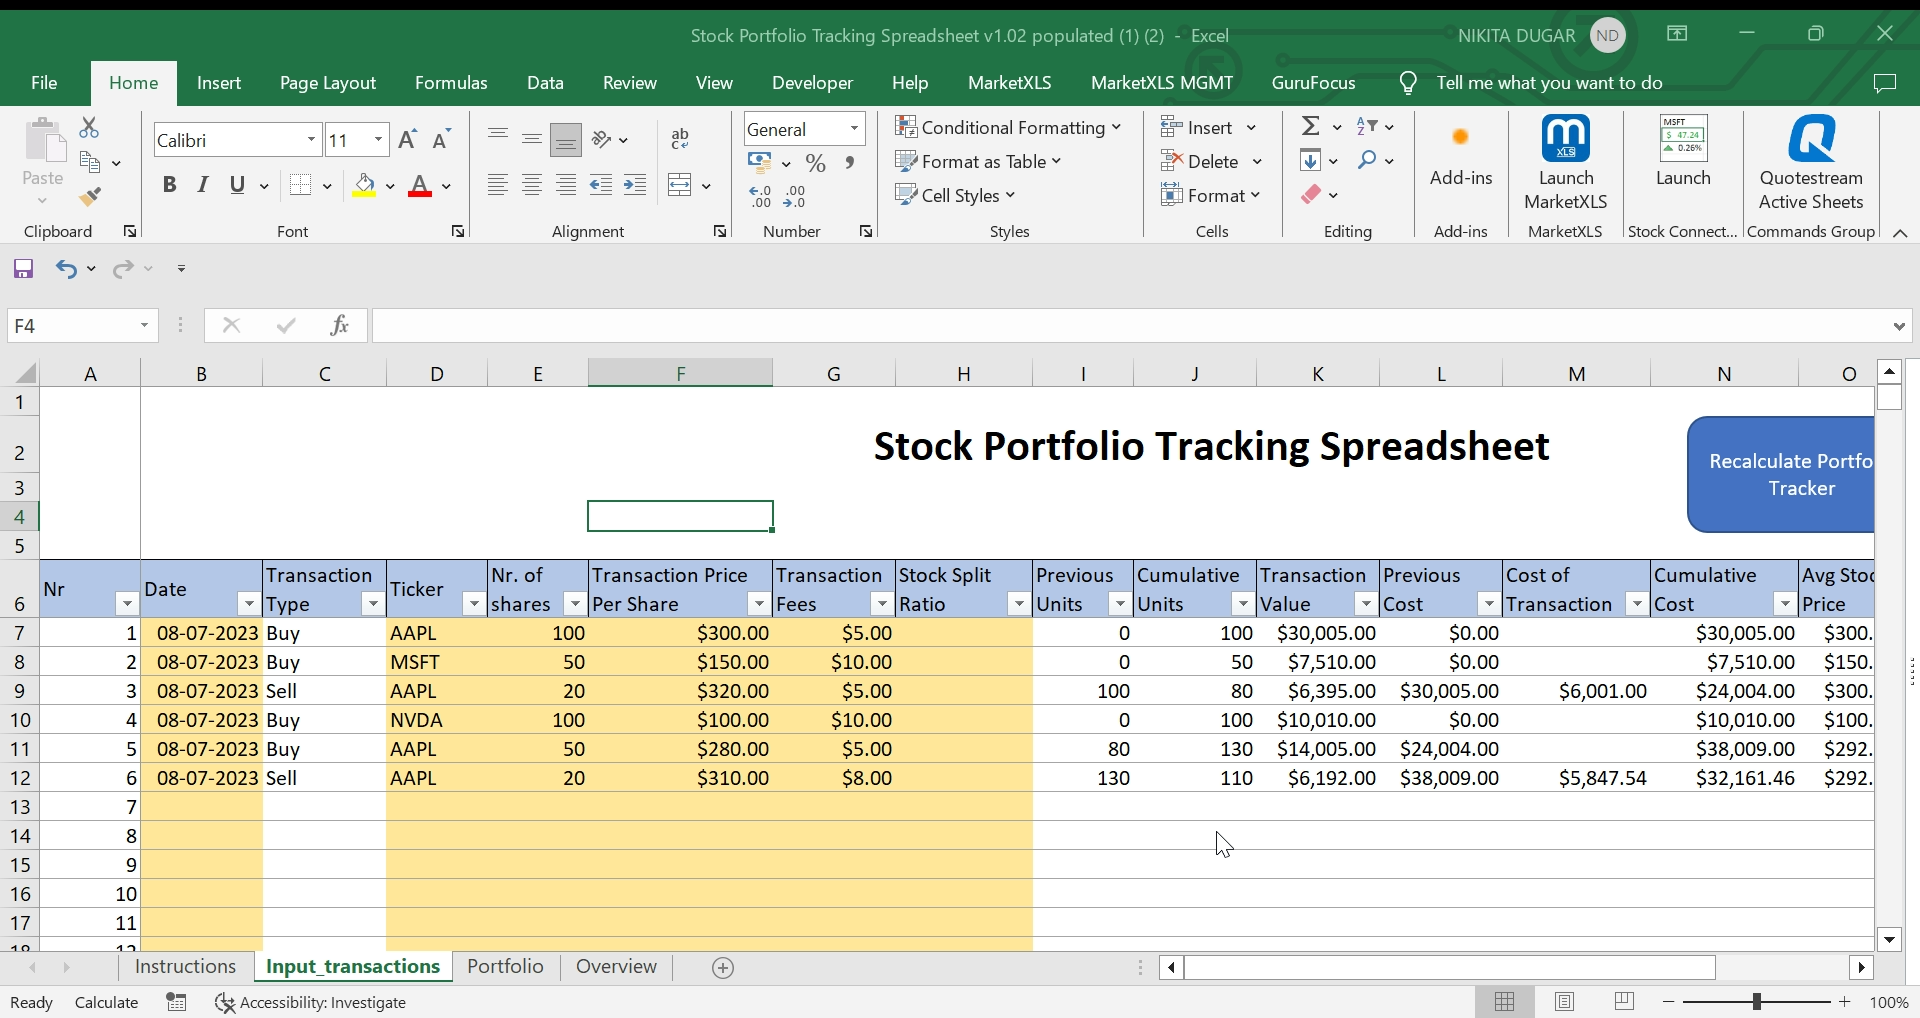
This sheet is the foundation where you import historical price data, financial statements, and key ratios. Use Excel’s Data → From Web feature or a CSV import to ensure the latest numbers are always at hand. Include columns for:
- Date (daily, weekly, or monthly)
- Open, High, Low, Close, Adjusted Close
- Volume
- Earnings per Share (EPS)
- Revenue, Net Income, and Free Cash Flow
- Debt‑to‑Equity, Current Ratio, and other balance‑sheet metrics
Calculations & Ratios
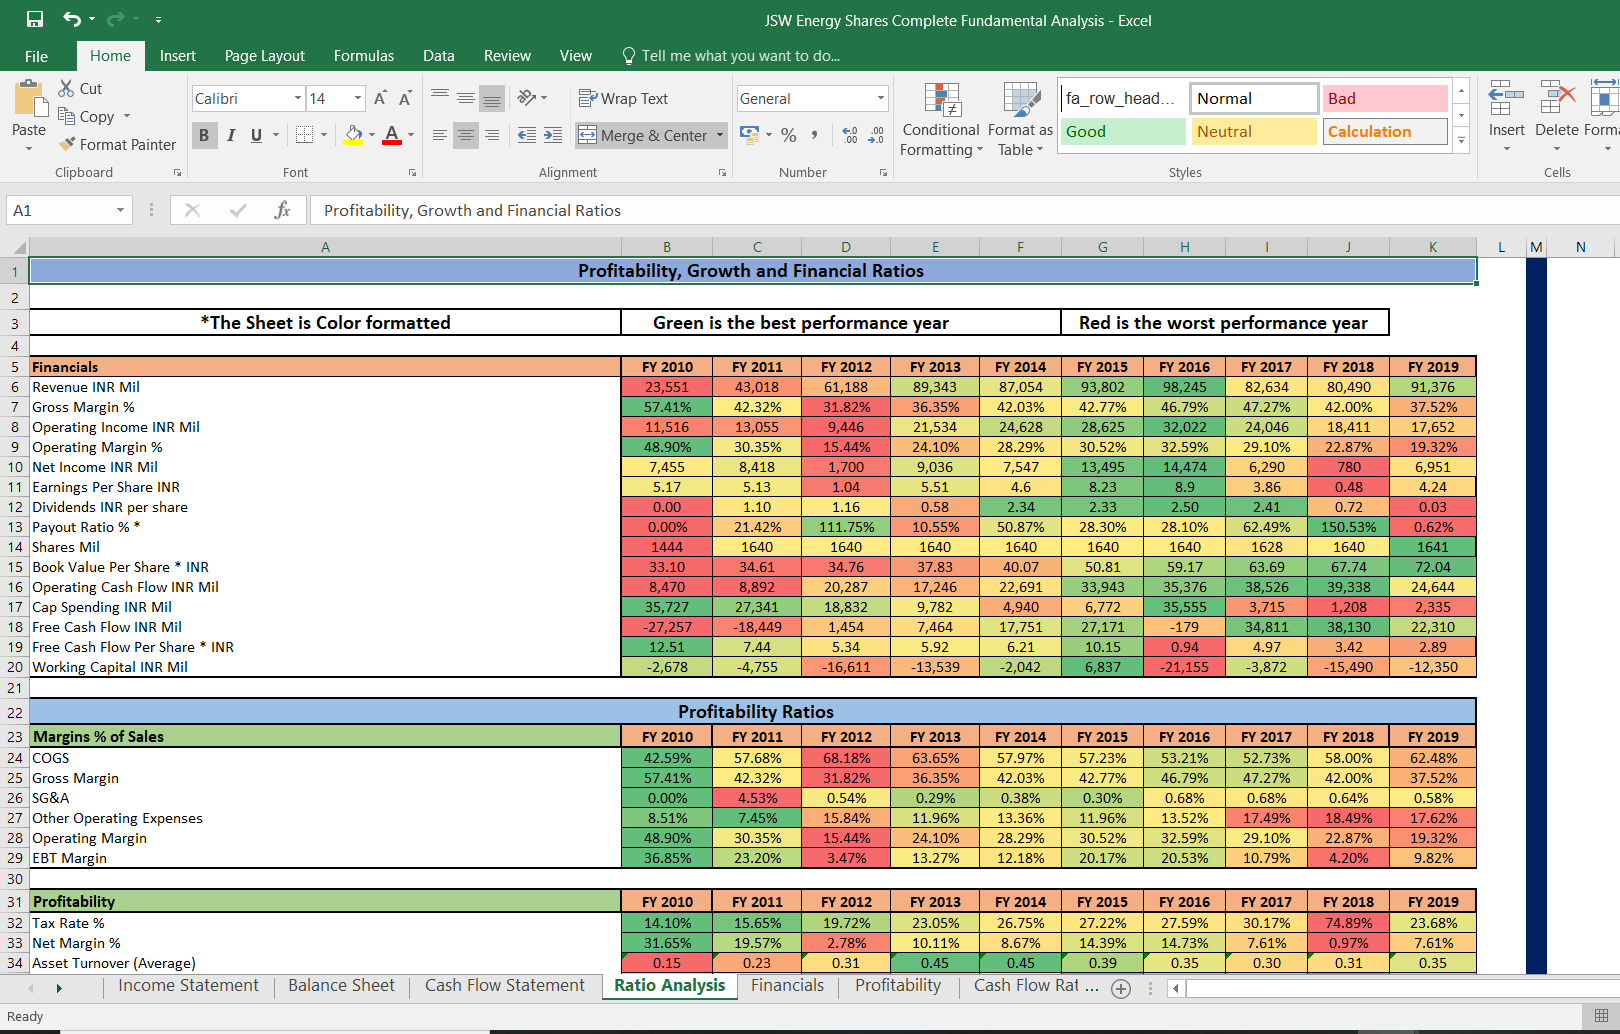
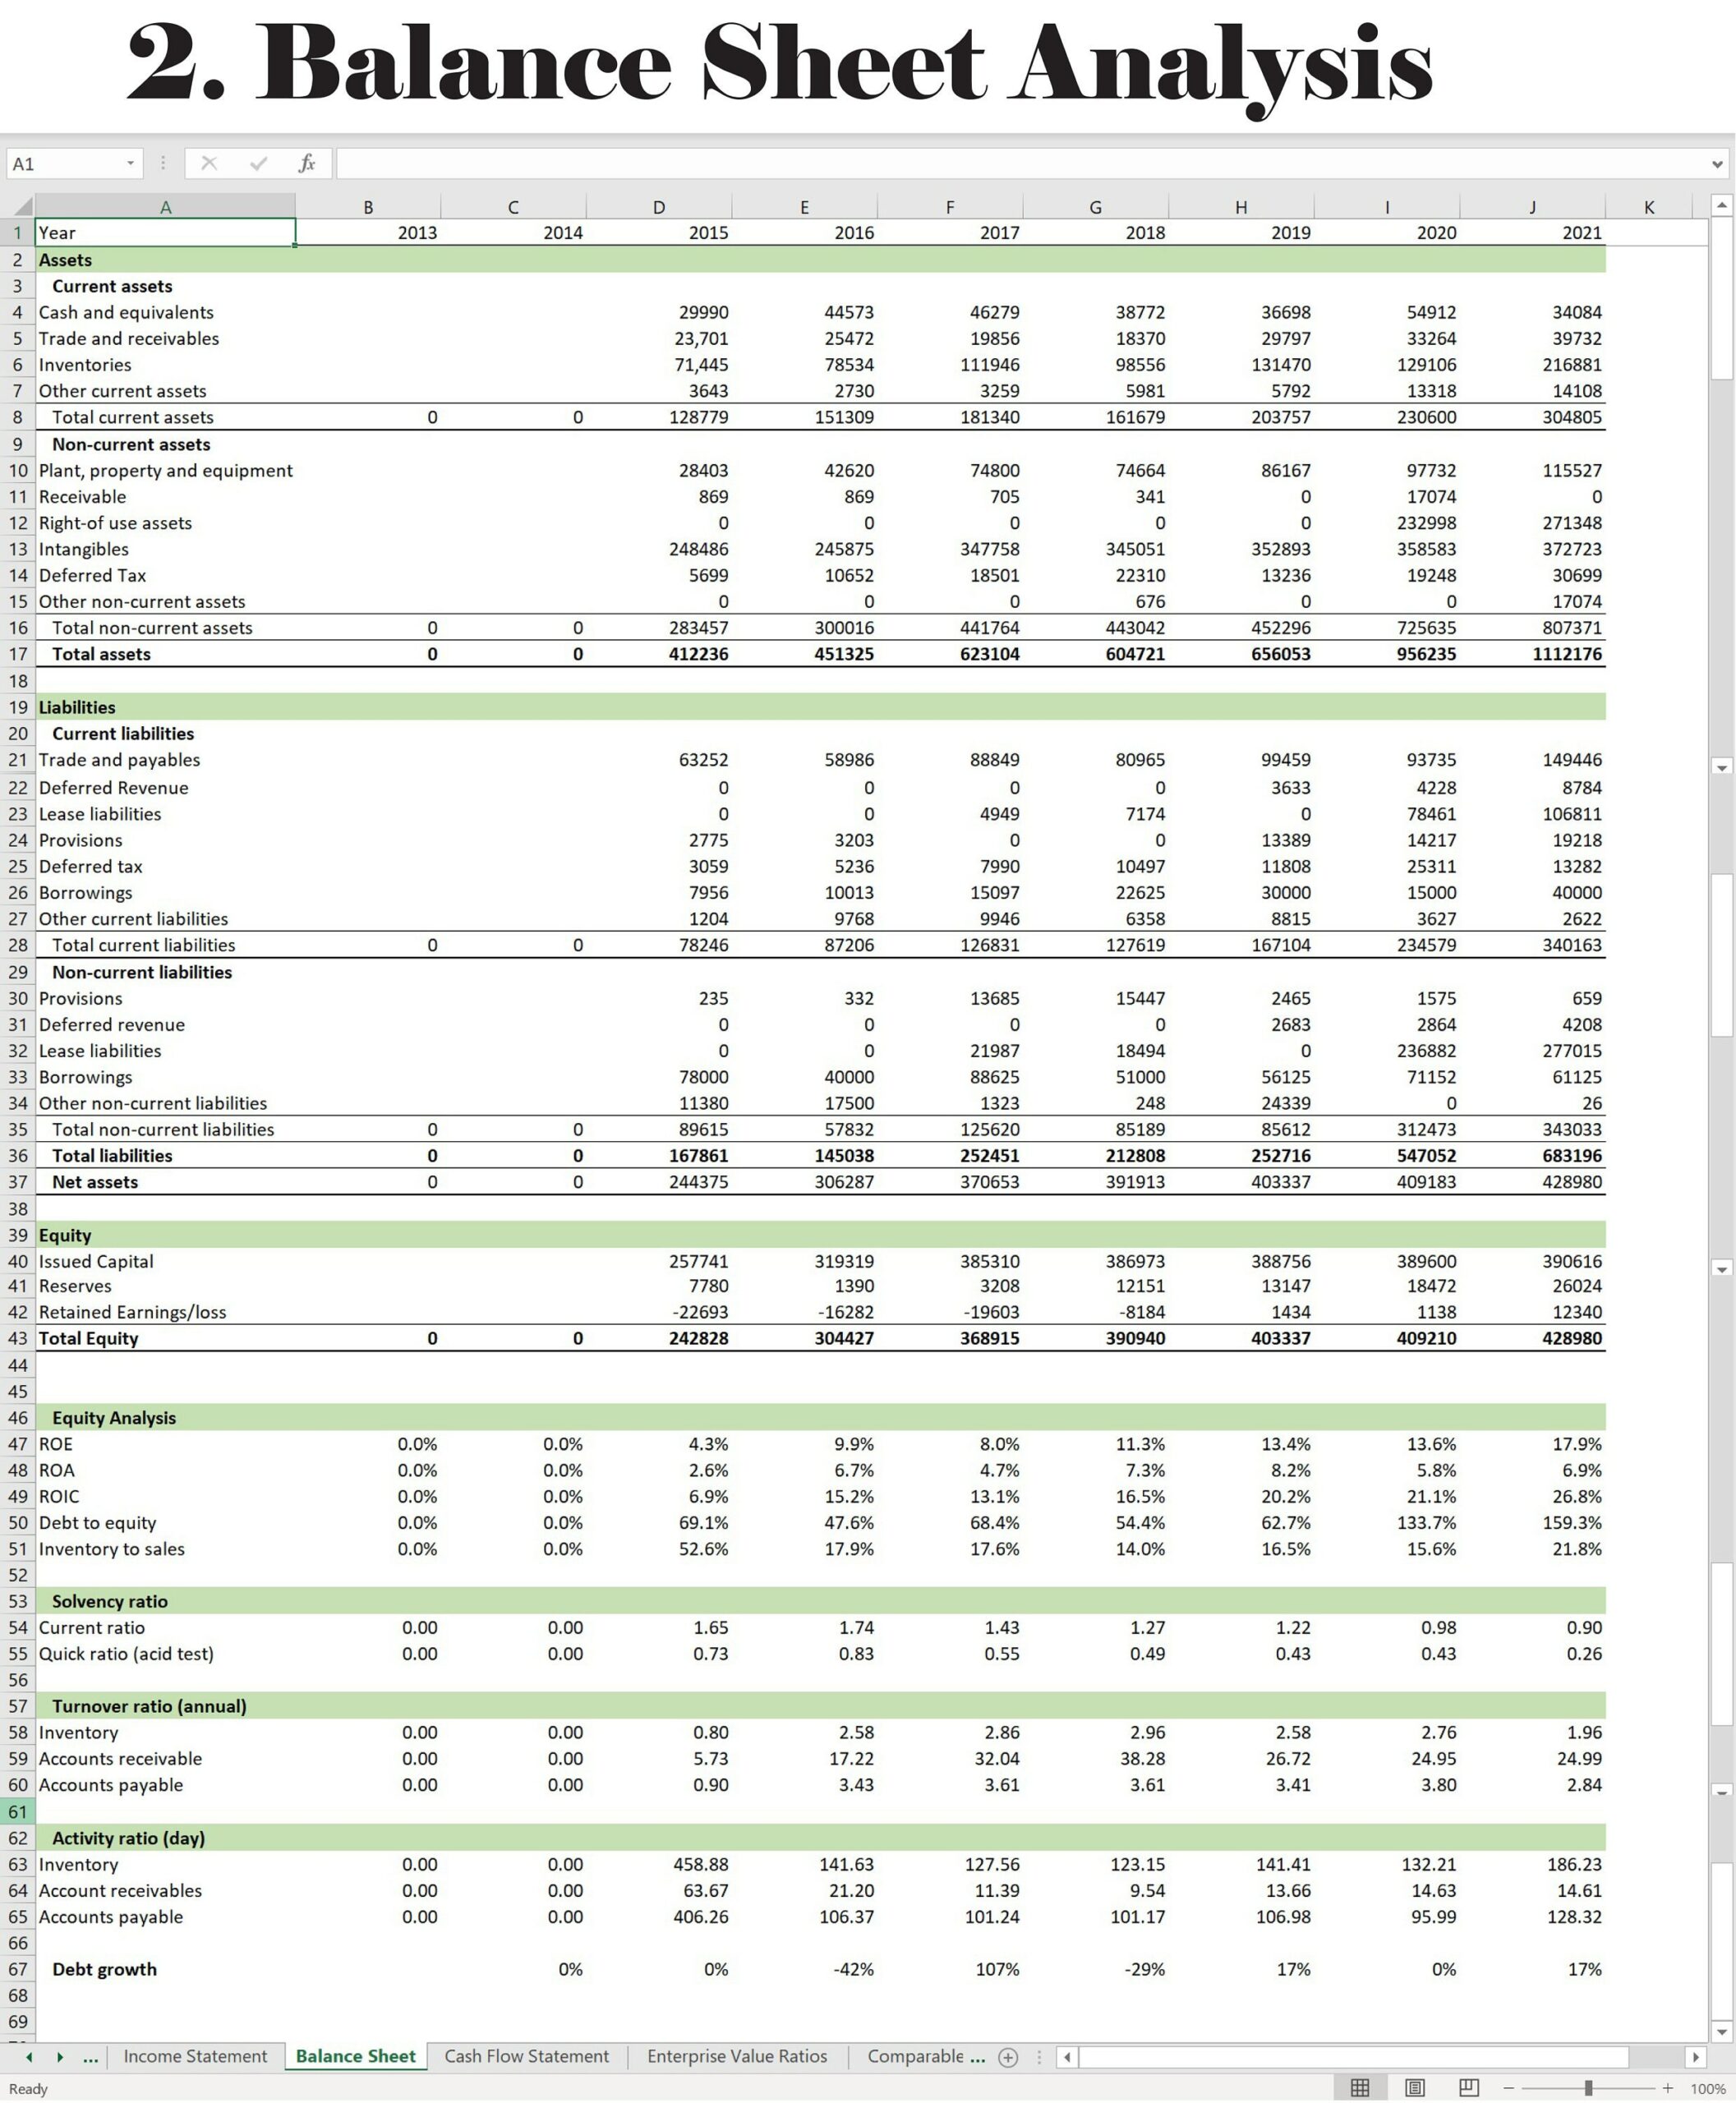
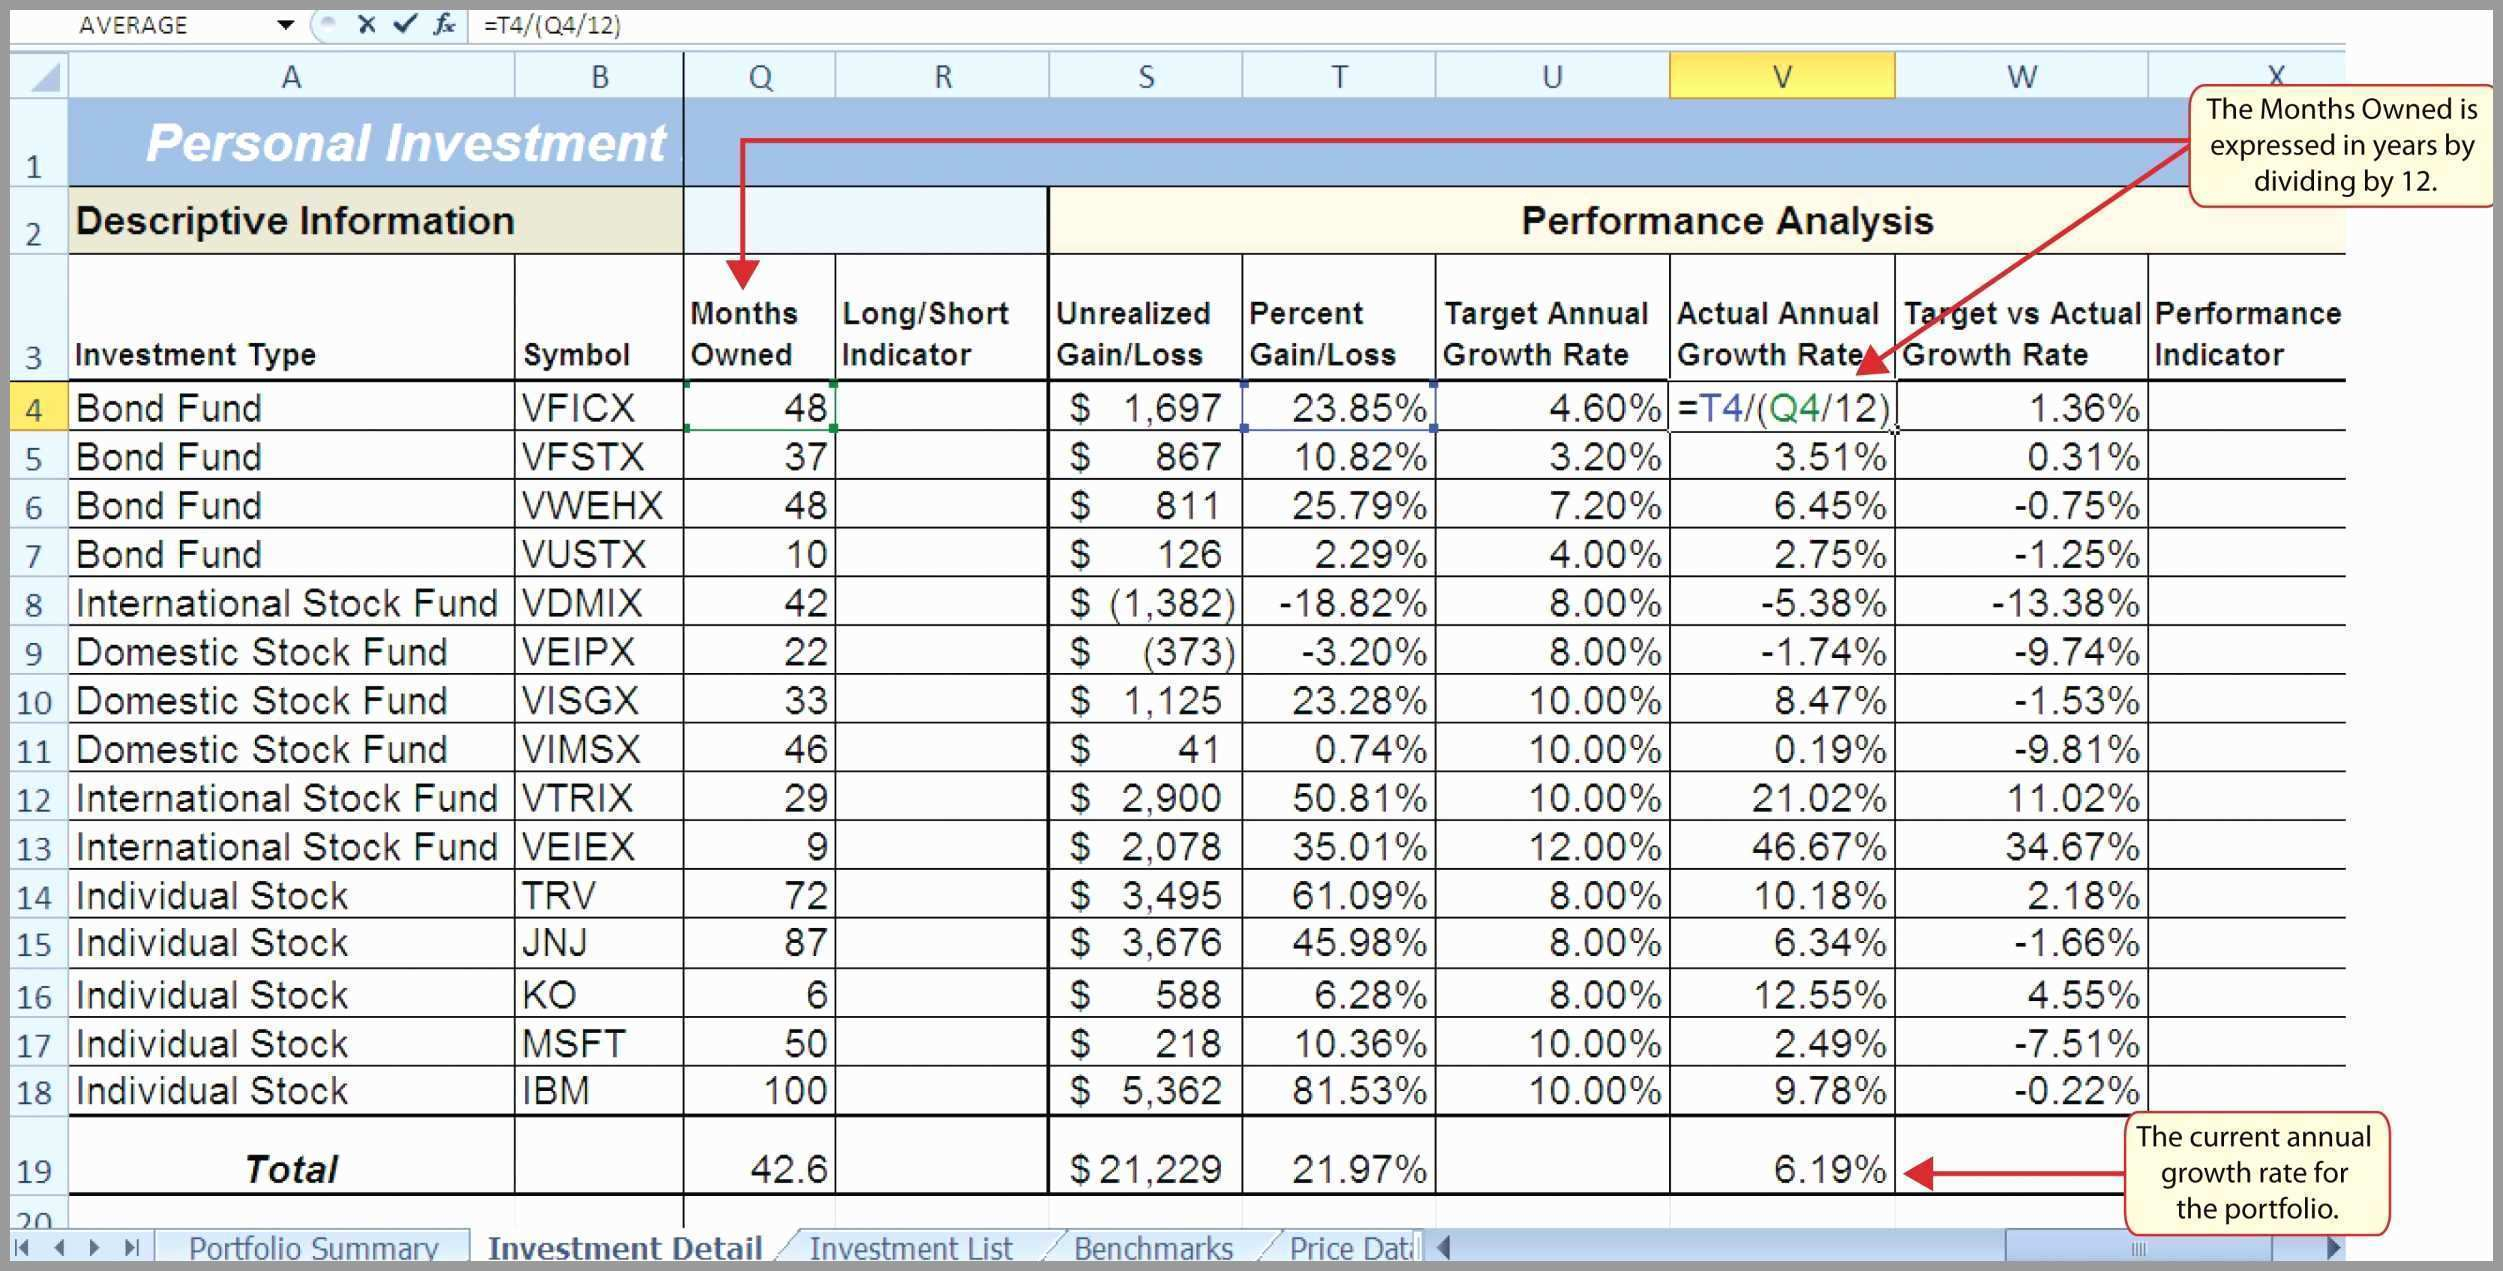
Transform raw data into actionable intelligence by calculating valuation and performance metrics. Typical formulas include:
- Price‑to‑Earnings (P/E) =
Close / EPS - Price‑to‑Book (P/B) =
Close / Book Value per Share - Dividend Yield =
Annual Dividend / Close - Return on Equity (ROE) =
Net Income / Shareholder Equity - Compound Annual Growth Rate (CAGR) for revenue and earnings
Each ratio should be computed in a separate column so that you can sort and filter effortlessly.
Visualization Dashboard
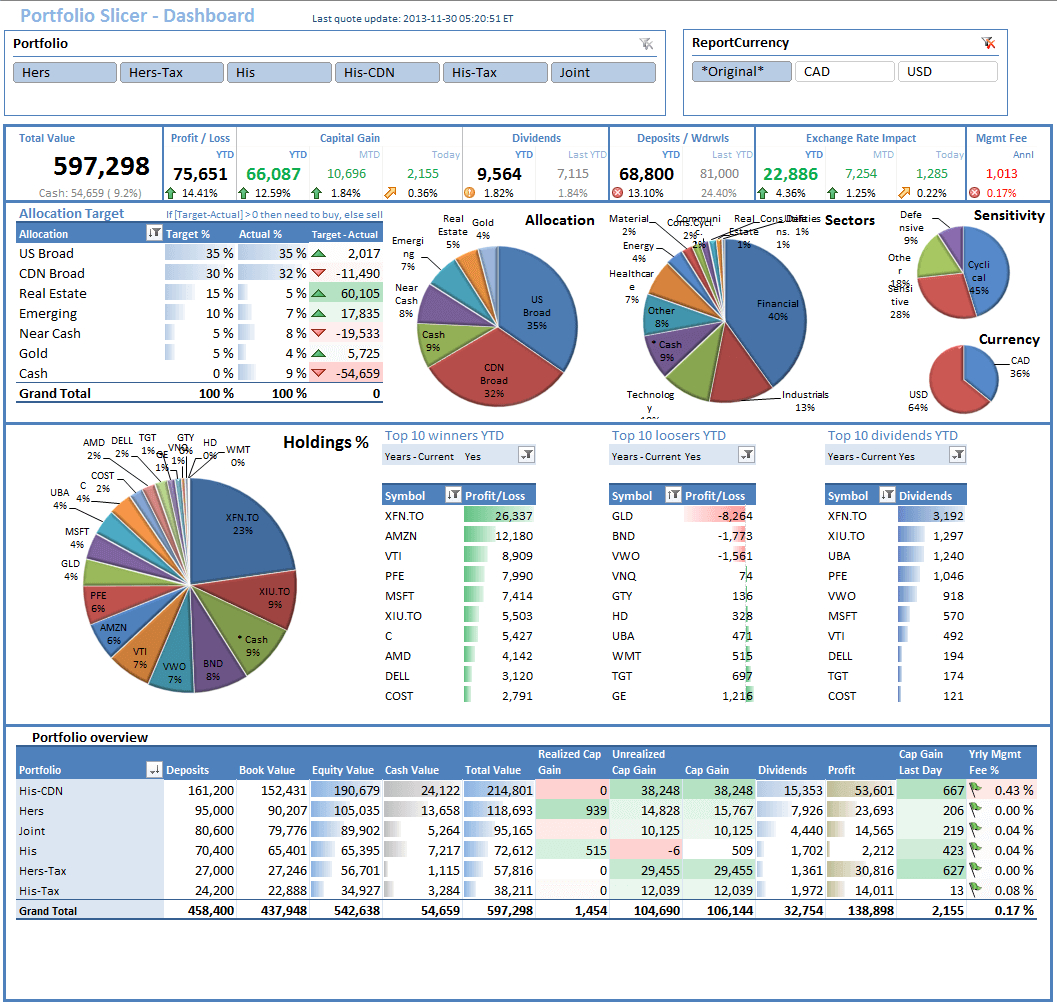
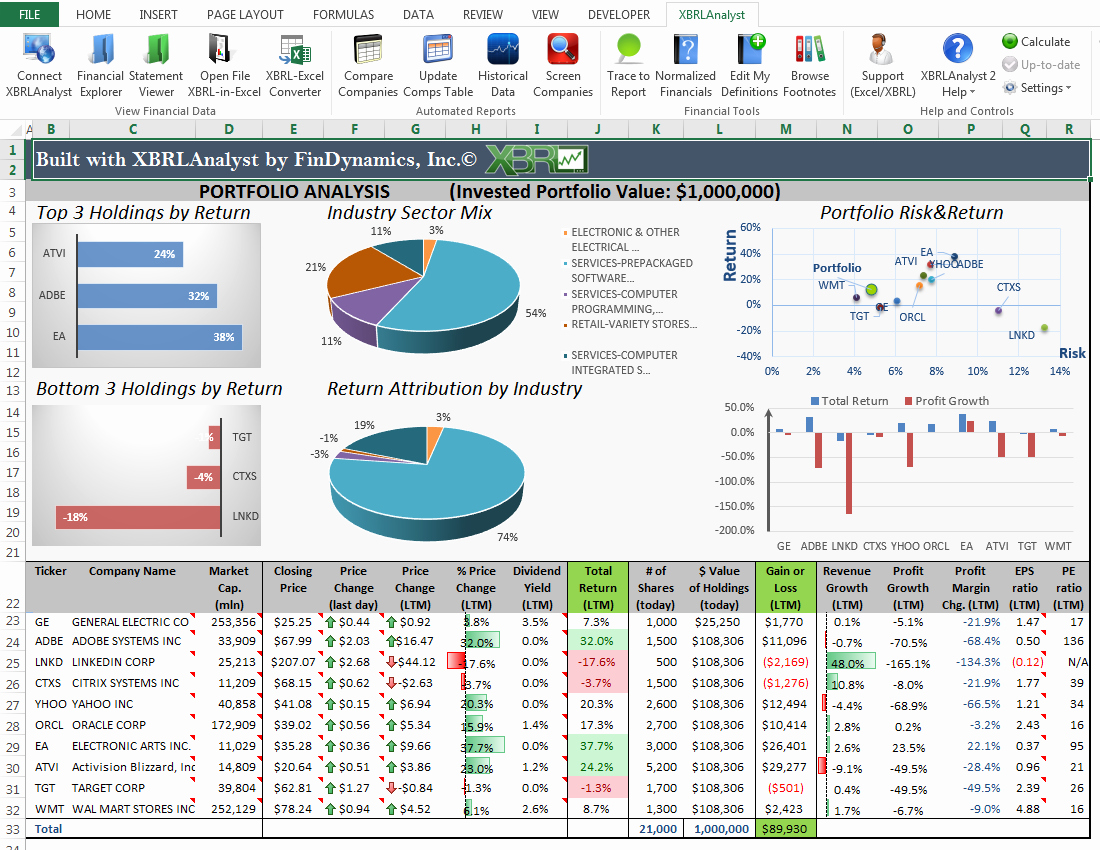
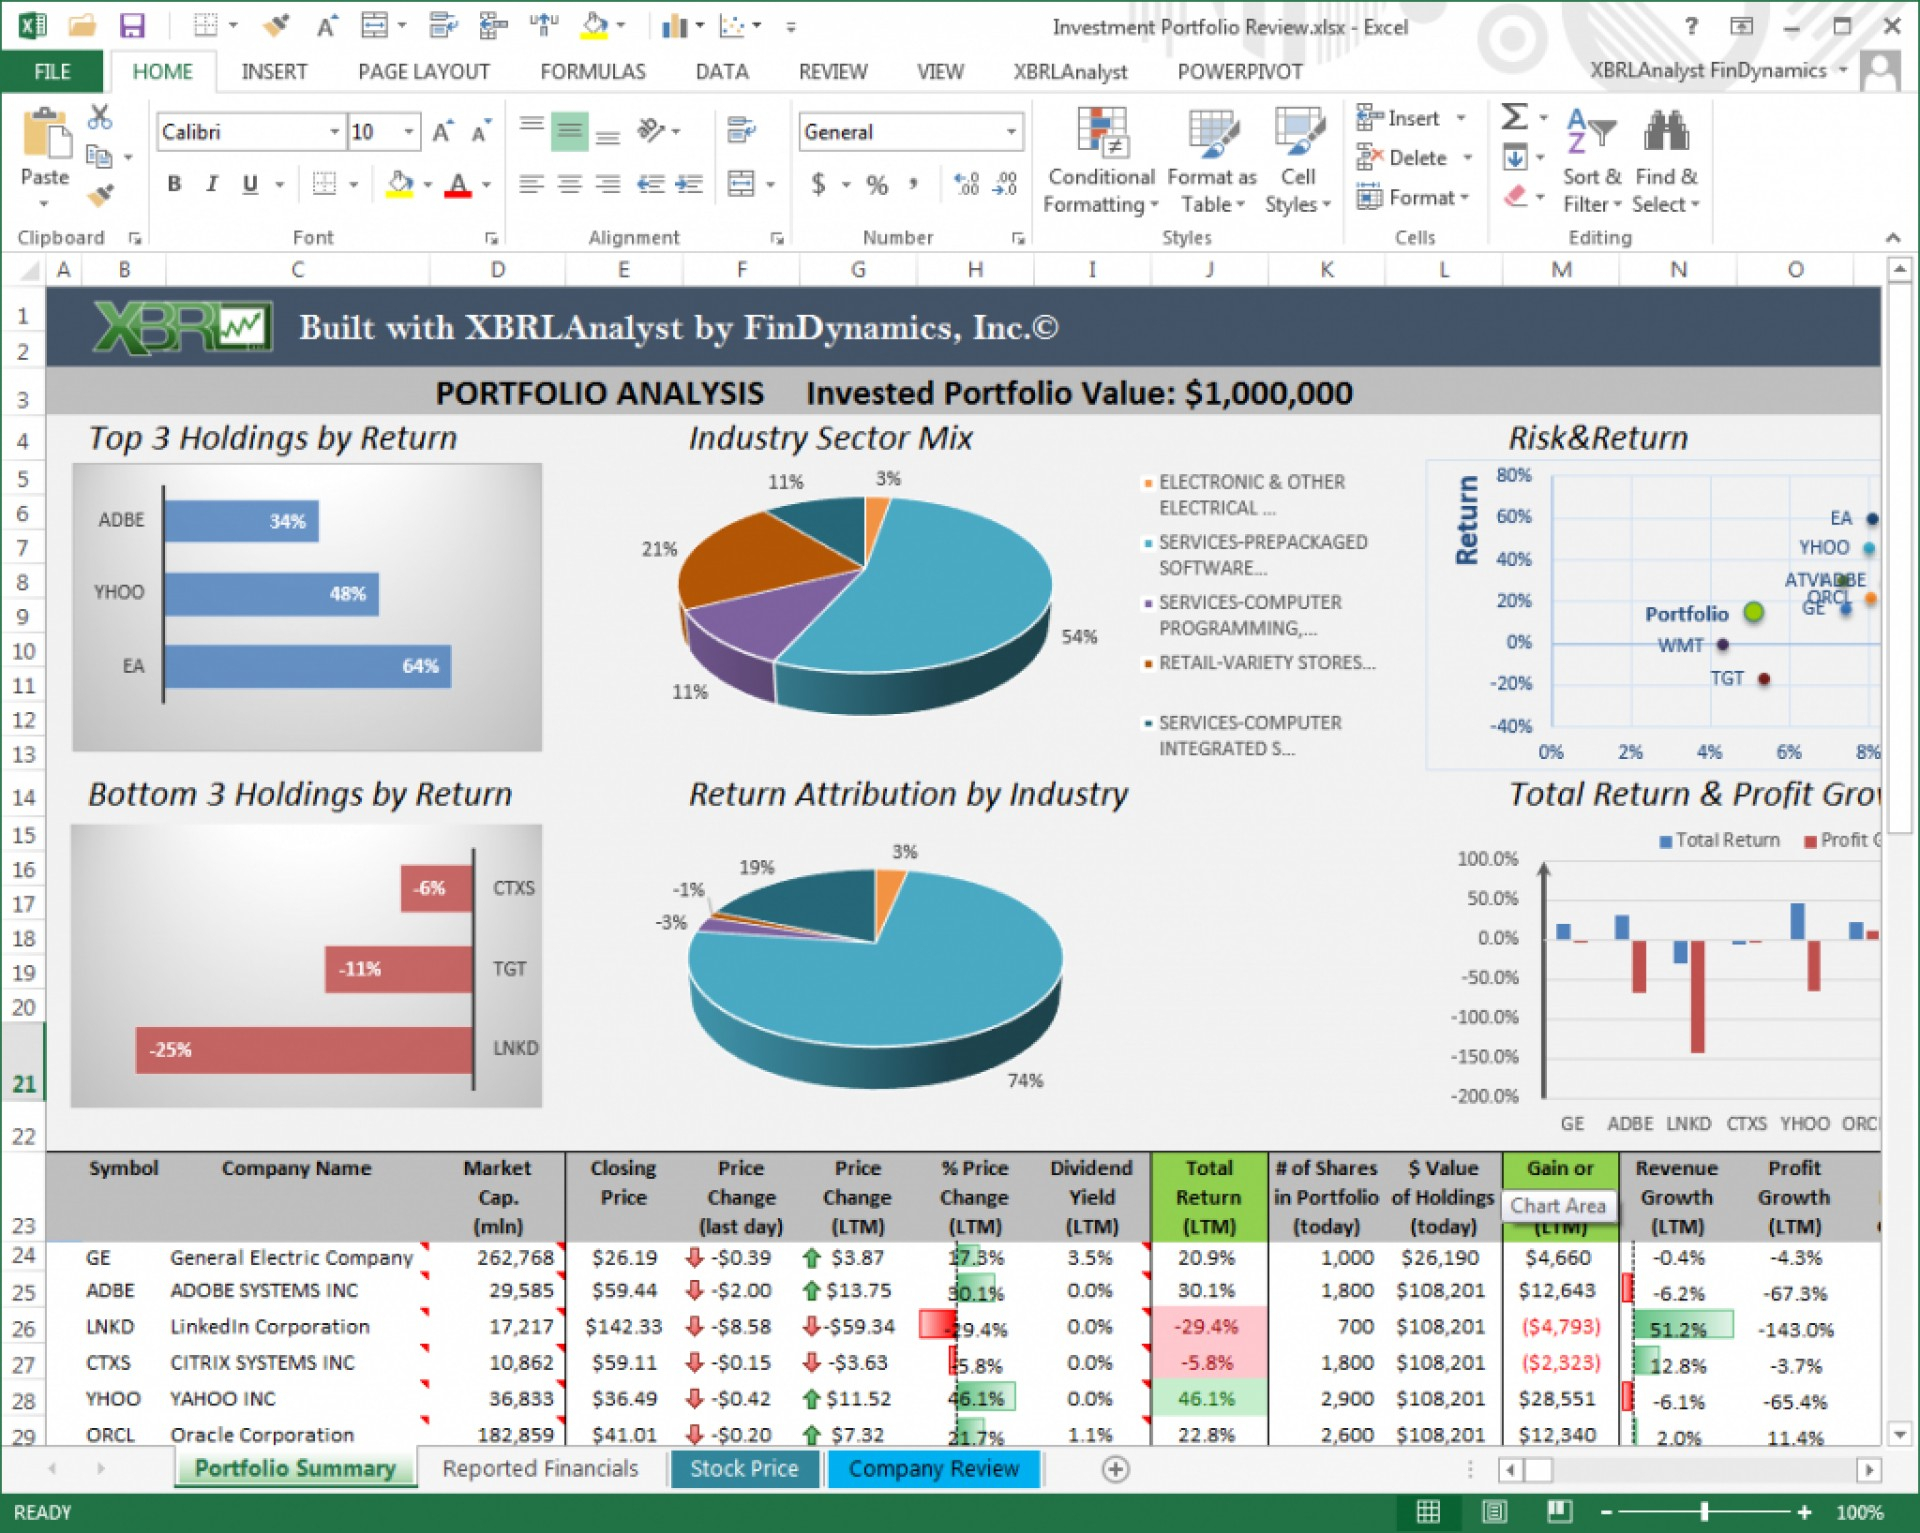
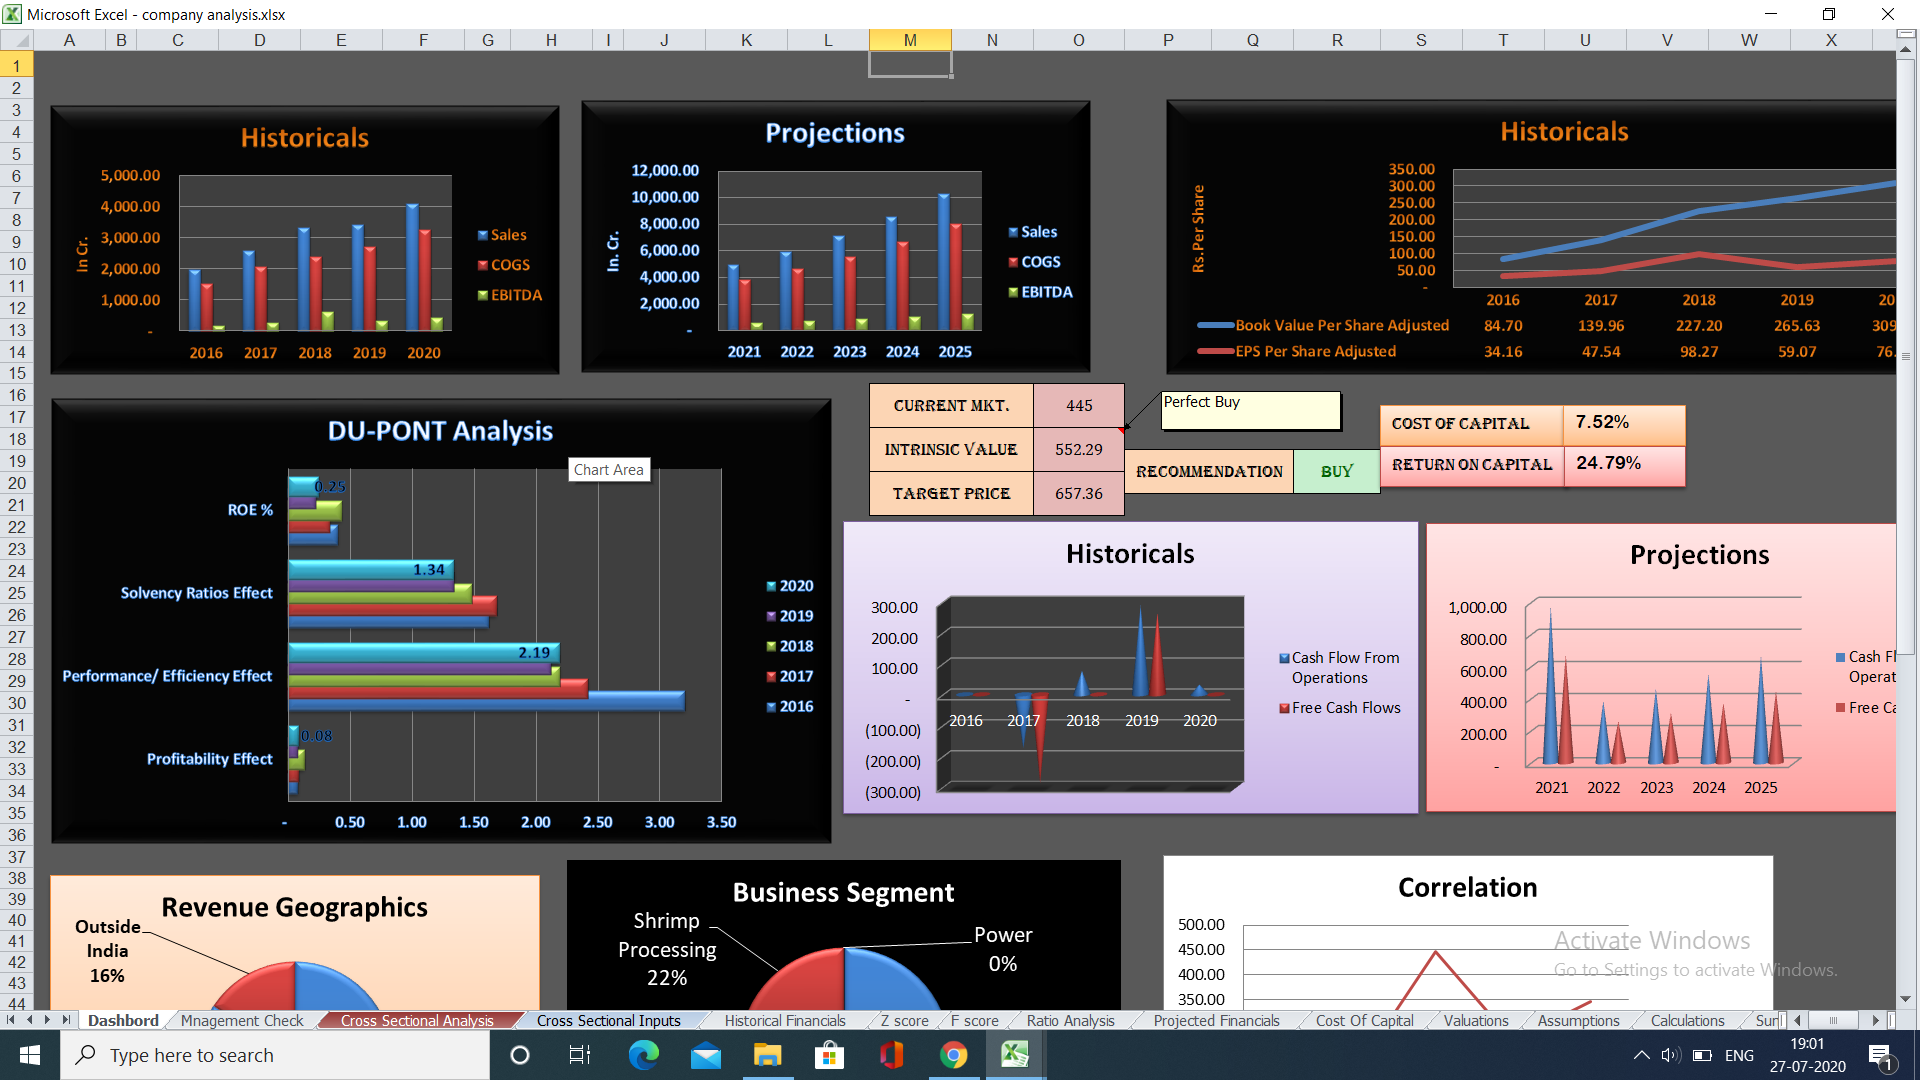
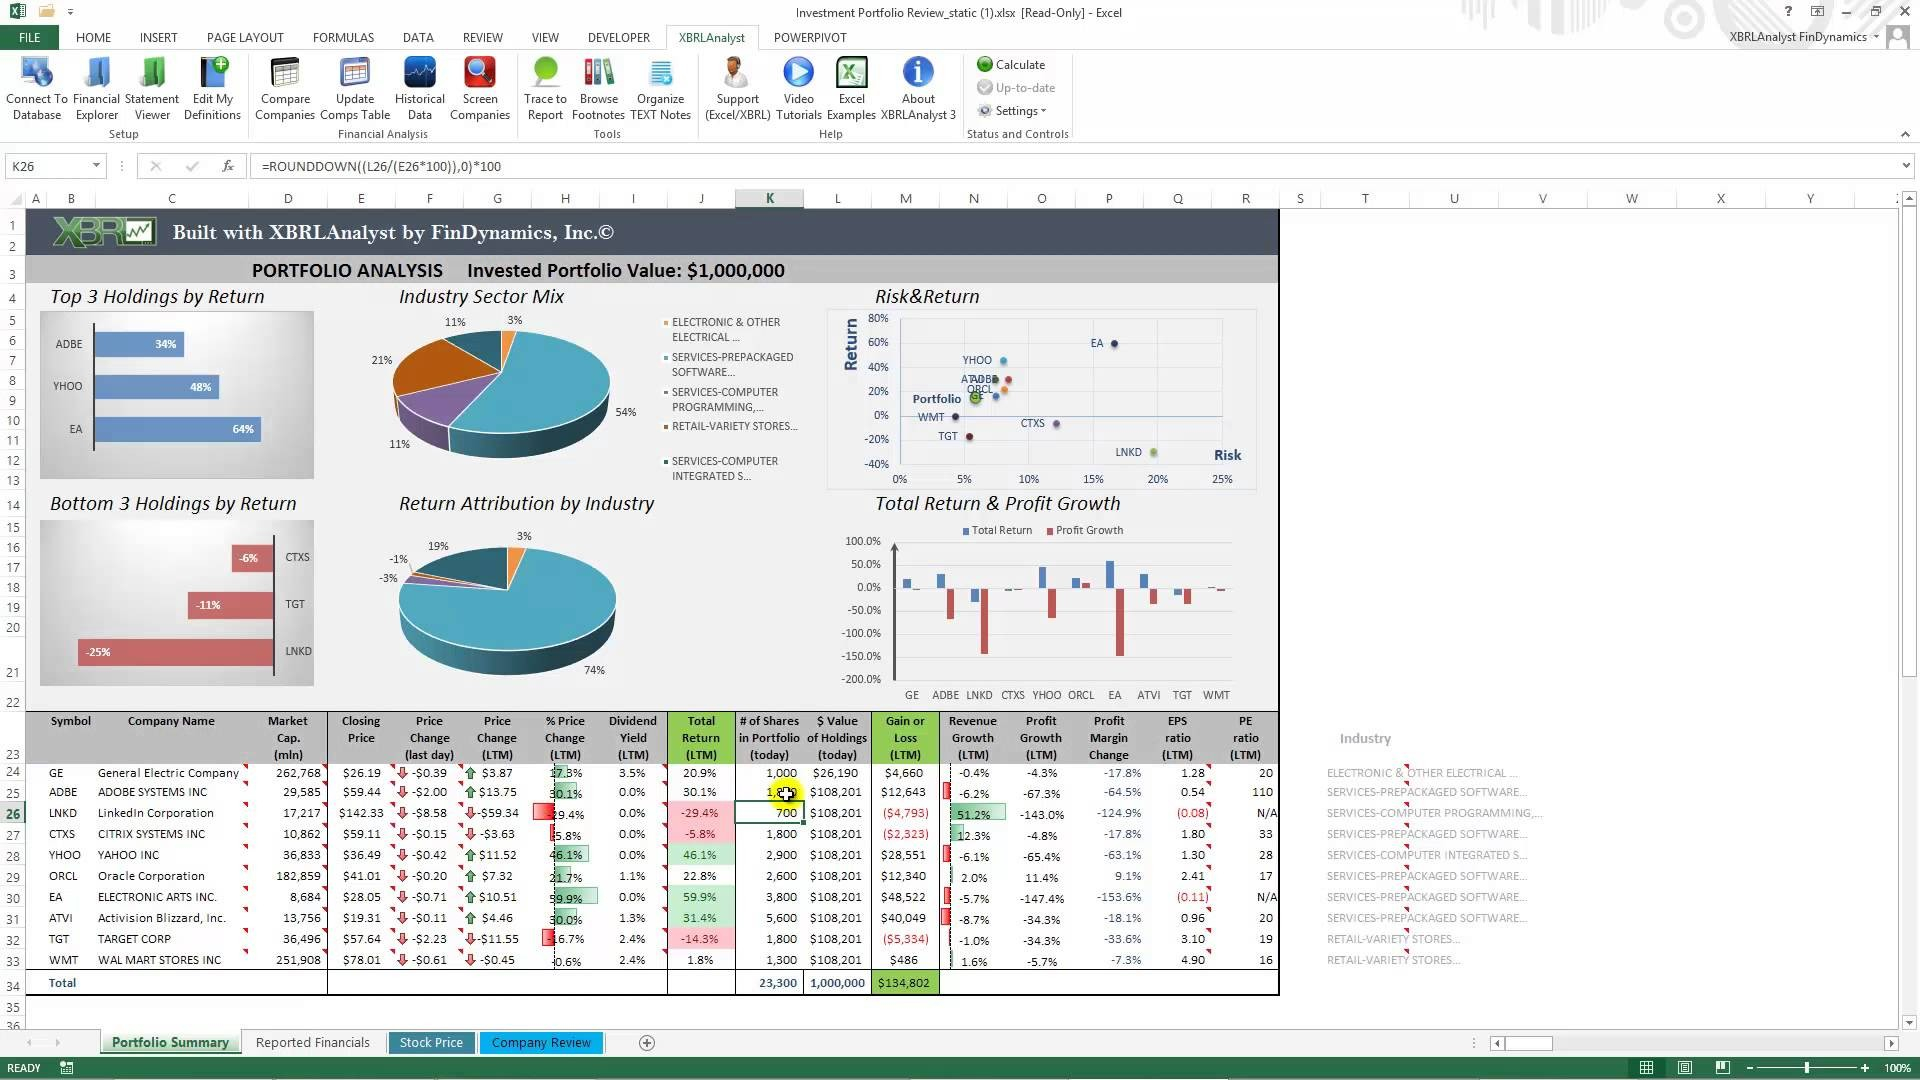
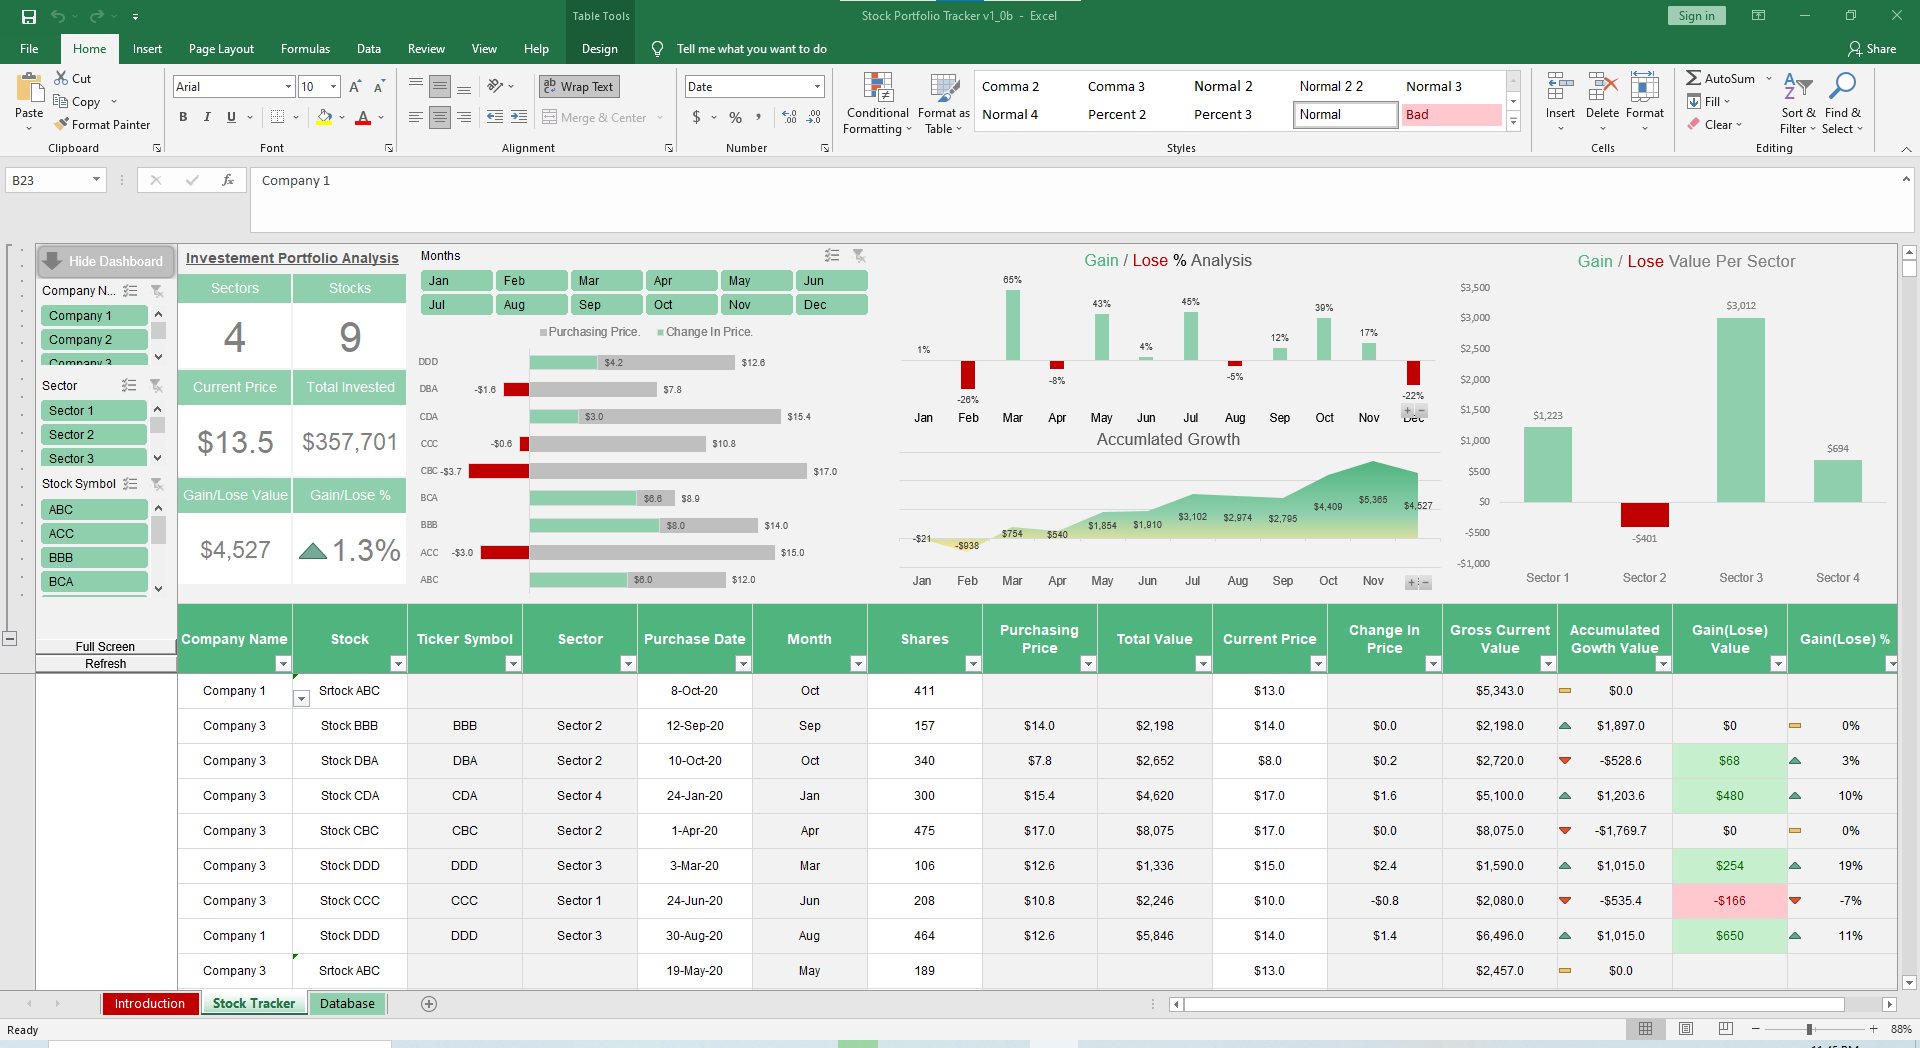
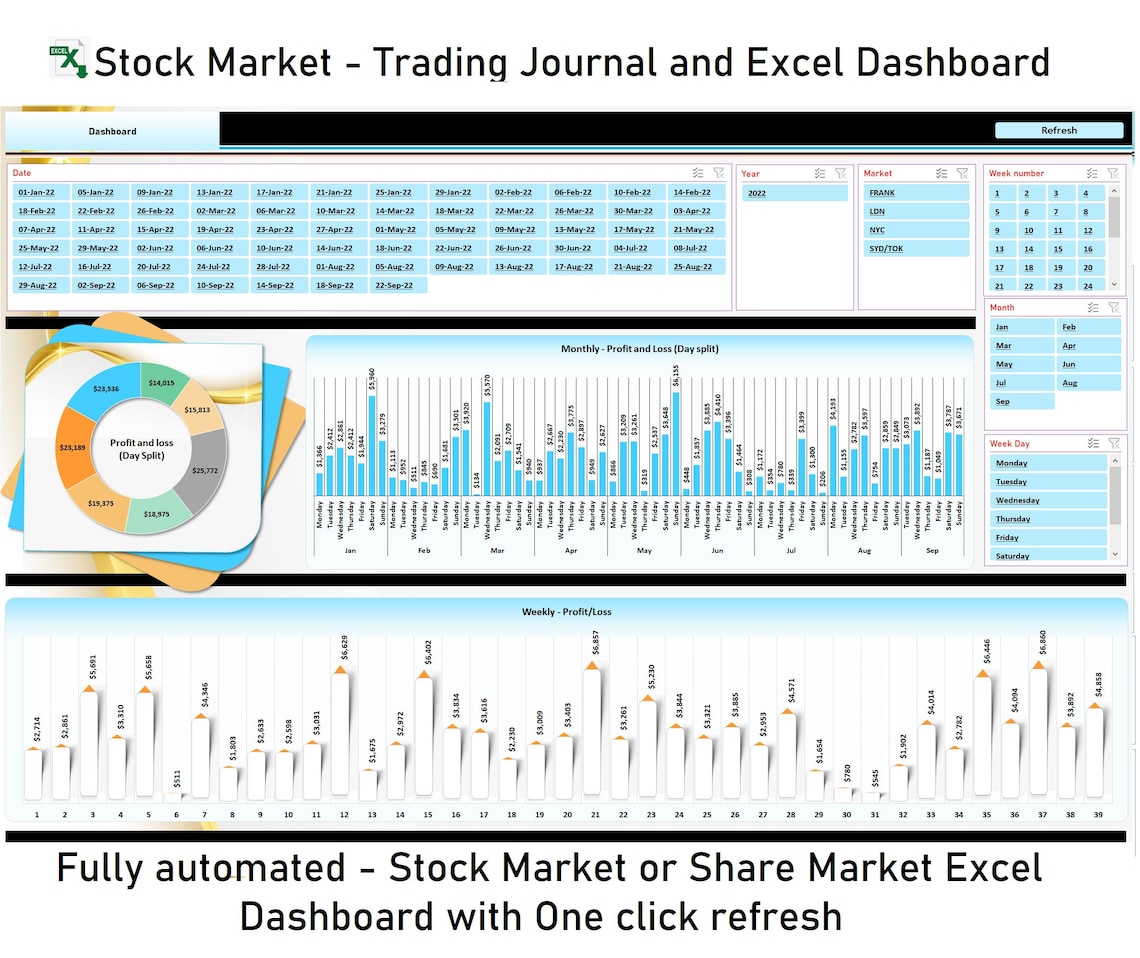
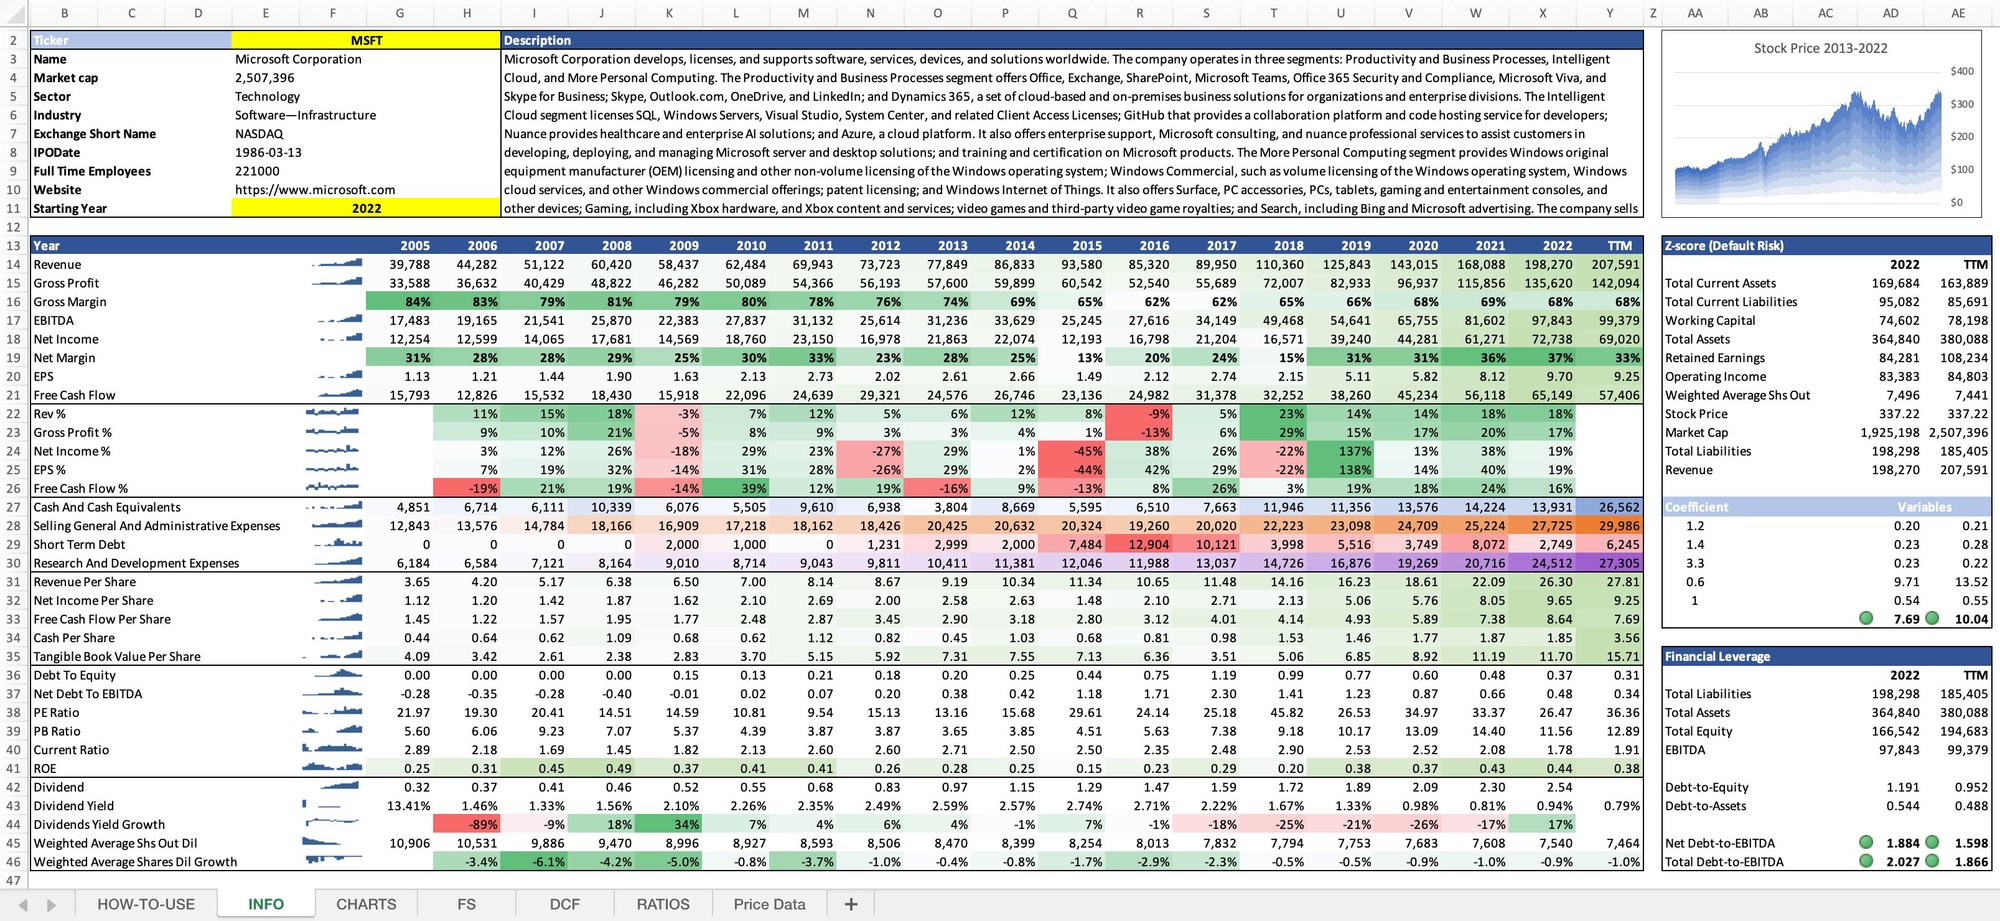
Visual cues help you digest complex data quickly. Include line charts for price trends, bar graphs for quarterly earnings, and scatter plots to compare valuation multiples against industry peers. Conditional formatting can highlight cells that breach predefined thresholds, such as a P/E above 30 or a dividend yield below 2%.
Scenario & Sensitivity Analysis
Use Excel’s data tables or the What‑If analysis tool to model how changes in assumptions—like a 10% earnings growth or a shift in discount rate—affect intrinsic value. This section empowers you to stress‑test your investment thesis before committing capital.
Step‑By‑Step Guide to Building Your Own Template
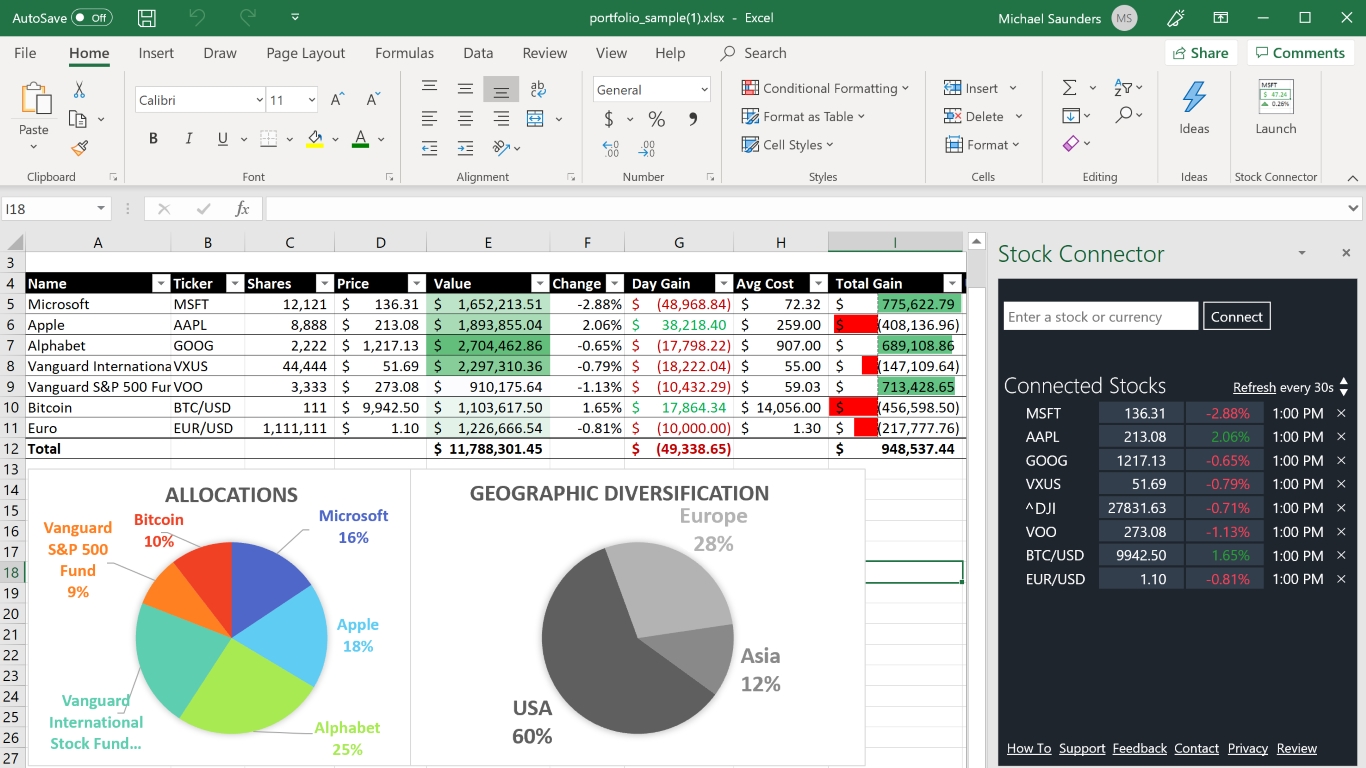
Even if you are new to Excel, constructing a comprehensive stock analysis workbook can be broken down into manageable steps.
Step 1: Set Up the Workbook Structure
Create four worksheets named Inputs, Metrics, Dashboard, and Scenarios. Keep each sheet focused on a single purpose to avoid clutter.
Step 2: Populate the Input Sheet
Download historical price data from a reliable source such as Yahoo Finance, then paste it into the Inputs sheet. Align the financial statement items by quarter or fiscal year, and label each column clearly. Use named ranges (e.g., Price_Close) to simplify formula references later.
Step 3: Build Ratio Calculations
Switch to the Metrics sheet and reference the named ranges to compute each ratio. For example, the P/E formula would be =Price_Close/EPS. Apply IFERROR wrappers to prevent #DIV/0! errors when data is missing.
Step 4: Design the Dashboard
Insert a line chart that pulls the Close price series. Add a secondary axis for volume to illustrate trading activity. Use the Insert → Recommended Charts wizard to quickly generate a clean visual. Apply a consistent color palette—blue for price, orange for volume—to reinforce brand consistency.
Step 5: Add Scenario Analysis
In the Scenarios sheet, create a table that lets you alter key inputs such as projected EPS growth or discount rate. Use the Data → What‑If → Data Table feature to auto‑populate a matrix of resulting valuations. This empowers you to compare best‑case, base‑case, and worst‑case outcomes side by side.
Step 6: Protect and Document
Lock the cells that contain formulas to prevent accidental overwriting. Add a small “Documentation” section that explains each metric, the source of data, and the assumptions behind scenarios. This practice is especially valuable when you revisit the model months later or share it with colleagues.
Advanced Features: Automating Calculations and Visualizations

Once the basic template is functional, you can introduce automation to save time and reduce manual errors.
Dynamic Data Refresh
Leverage Excel’s Power Query (Get & Transform) to pull live price feeds directly from the web. Set the query to refresh on opening the workbook, ensuring you always work with the most recent data without copy‑pasting.
VBA Macros for Repetitive Tasks
If you frequently generate a new analysis for a different ticker, a simple VBA macro can duplicate the template, rename the sheets, and replace the ticker symbol throughout the workbook. Here is a concise example:
Sub NewAnalysis()
    Dim ws As Worksheet
    Sheets("Template").Copy After:=Sheets(Sheets.Count)
    Set ws = ActiveSheet
    ws.Name = InputBox("Enter ticker symbol")
    ws.Cells.Replace What:="TICKER", Replacement:=ws.Name, LookAt:=xlPart
End Sub
Running this macro reduces a multi‑minute process to a single click.
Conditional Formatting for Alerts
Set rules that change the cell background to red when a ratio exceeds a risk threshold, or green when it meets a target. For instance, a rule like “Cell Value > 25” applied to the P/E column instantly flags overvalued stocks.
Interactive Slicers and Timelines
Insert slicers linked to your data tables to filter by sector, market cap, or date range. Timelines provide an intuitive way to shift the chart view from one year to five years, giving you a quick visual of long‑term performance.
Common Pitfalls and How to Avoid Them

Even seasoned analysts can stumble if they overlook best practices. Below are frequent mistakes and practical remedies.
Using Stale Data
Never rely on a snapshot that is more than a few days old for active trading decisions. Schedule automatic data refreshes and double‑check the source timestamps before analysis.
Hard‑Coding Values
Embedding numbers directly into formulas makes updates laborious and error‑prone. Always reference cells, named ranges, or external tables so that a single change propagates throughout the model.
Overcomplicating the Layout
A cluttered workbook slows you down. Keep the design simple: one sheet for raw data, one for calculations, and a concise dashboard. Use consistent column widths and font sizes to improve readability.
Ignoring Data Validation
Enable Excel’s data validation tools to restrict inputs to realistic ranges (e.g., EPS cannot be negative for a profitable company). This guards against accidental entry errors that could skew results.
Failing to Document Assumptions
Every model is built on assumptions—growth rates, discount rates, tax rates, etc. Write a brief note next to each key input explaining the rationale. Documentation not only aids personal recall but also builds credibility when sharing the model.
Best Practices for Maintaining Data Integrity
Long‑term success with an Excel template hinges on disciplined data management.
Version Control
Save incremental versions of your workbook (e.g., StockAnalysis_v1.xlsx, v2, …) or use a cloud platform like OneDrive with version history enabled. This allows you to revert to a prior state if a formula error is discovered.
Regular Audits
Schedule a quarterly review where you verify that formulas still reference the correct cells, that no circular references have been introduced, and that all links to external data sources are functional.
Backup Critical Files
Maintain an off‑site backup on an external drive or secure cloud storage. Excel files can become corrupted; a backup ensures you never lose valuable analysis.
Standardized Naming Conventions
Adopt a naming scheme for worksheets, tables, and named ranges that reflects their purpose (e.g., tbl_Earnings, rng_PriceClose). Consistency speeds navigation and reduces the chance of misreferencing.
Real‑World Example: Analyzing a Growth Portfolio
To illustrate the power of a customized Excel template, let’s walk through a concise case study of a three‑stock growth portfolio consisting of TechCo, BioGen, and CleanEnergy.
Data Collection
For each ticker, we imported the last five years of monthly closing prices, quarterly revenue, net income, and free cash flow. The data was placed in the Inputs sheet under separate sections labeled by ticker.
Key Metrics Computed
- TechCo: P/E = 28, CAGR (Revenue) = 15%, ROE = 22%
- BioGen: P/E = 45, CAGR (Revenue) = 30%, ROE = 18%
- CleanEnergy: P/E = 22, CAGR (Revenue) = 12%, ROE = 25%
These numbers revealed that BioGen, despite a high valuation, offered the strongest growth trajectory, while CleanEnergy provided the highest return on equity at a reasonable price.
Scenario Modeling
We built a three‑scenario model for each stock: Base (industry‑average growth), Bull (+10% growth), and Bear (‑10% growth). Using the discounted cash flow (DCF) method with a 10% discount rate, the intrinsic values emerged as follows:
- TechCo: Base $120, Bull $150, Bear $95
- BioGen: Base $210, Bull $260, Bear $165
- CleanEnergy: Base $78, Bull $90, Bear $68
Comparing these intrinsic values to current market prices highlighted that CleanEnergy was undervalued in the base case, while BioGen appeared slightly overvalued unless the bullish growth scenario materialized.
Decision Dashboard
The final dashboard displayed a stacked bar chart of intrinsic versus market price, conditional formatting to flag overvalued (red) and undervalued (green) positions, and a slicer to toggle between scenarios. This visual summary allowed the investor to quickly allocate capital: 40% to CleanEnergy, 35% to TechCo, and a cautious 25% to BioGen pending a bullish catalyst.
Conclusion
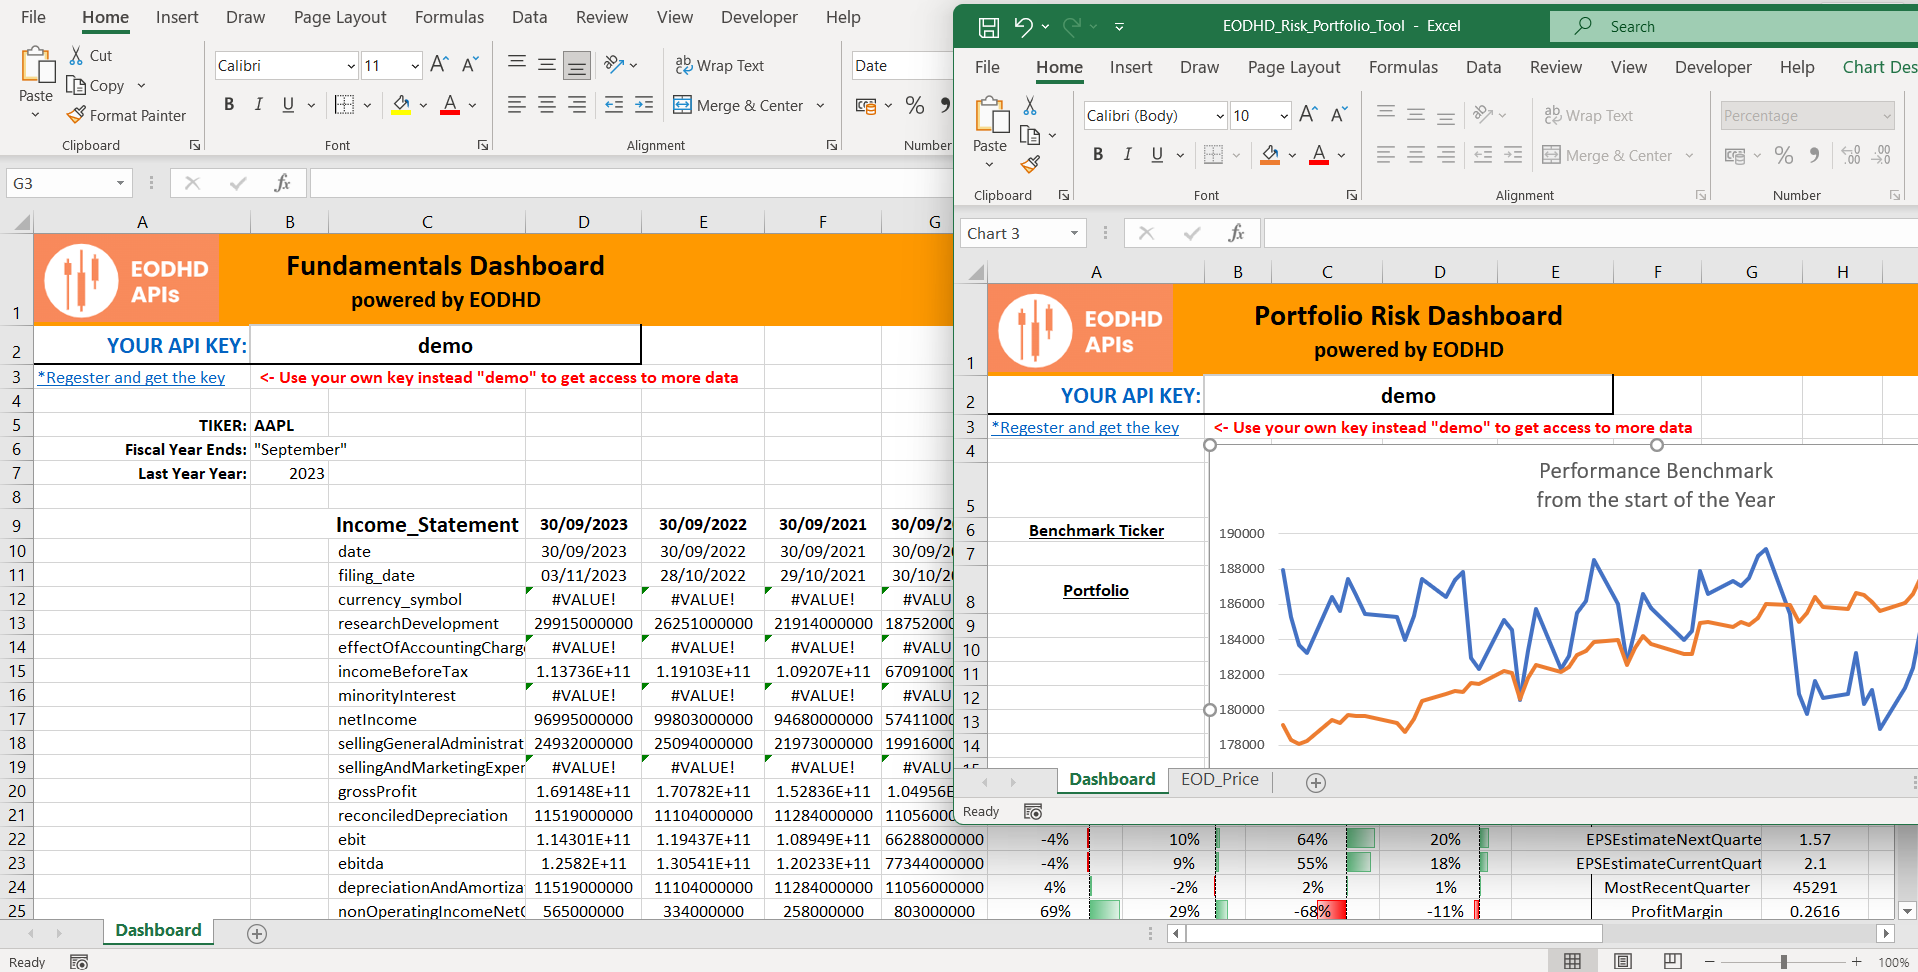
By integrating a purpose‑built Excel Template For Stock Analysis into your investment workflow, you gain a repeatable, transparent, and data‑driven process that enhances both accuracy and confidence. The template’s modular design—spanning data input, ratio calculation, dynamic visualizations, and scenario analysis—provides a comprehensive toolkit for evaluating individual securities or entire portfolios. Adhering to best practices such as automated data refresh, rigorous documentation, and regular audits ensures that the model remains reliable over time. Whether you are a seasoned analyst or a retail investor seeking a systematic edge, mastering Excel’s capabilities empowers you to uncover hidden opportunities, mitigate risk, and make well‑informed decisions that align with your financial goals.