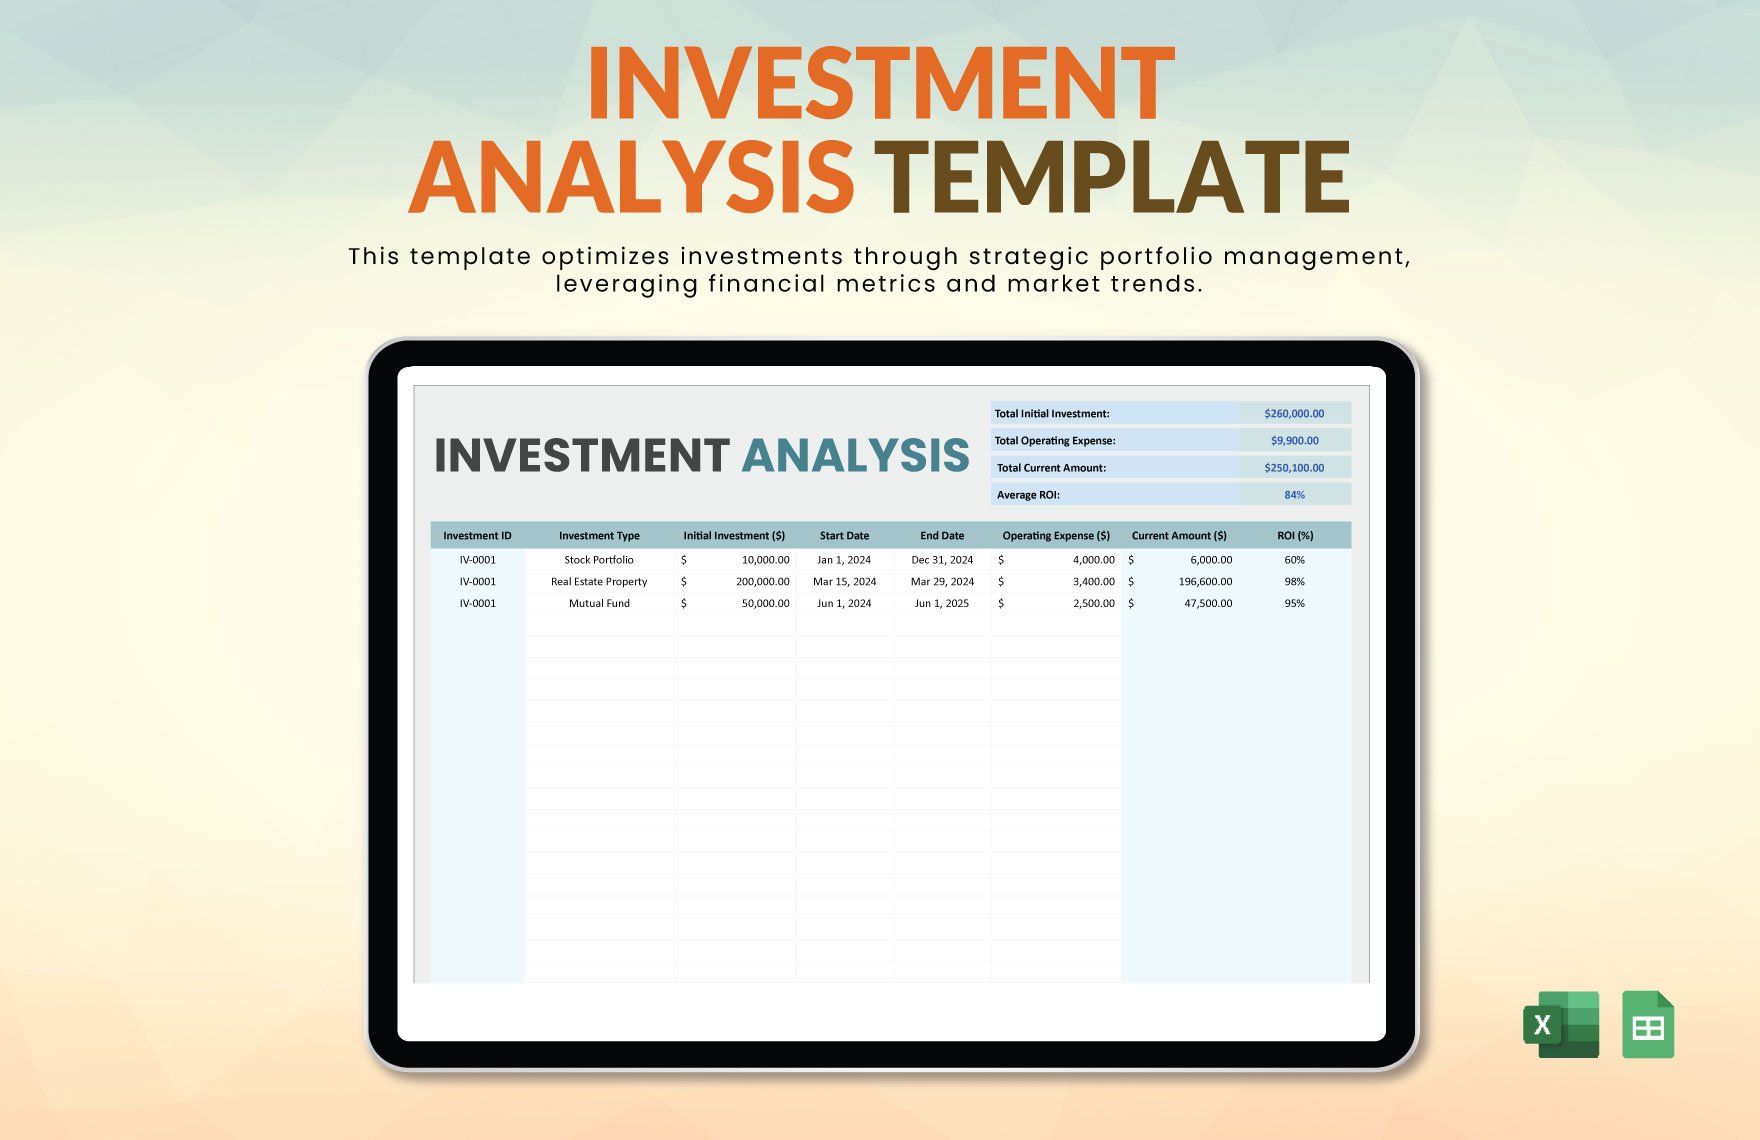
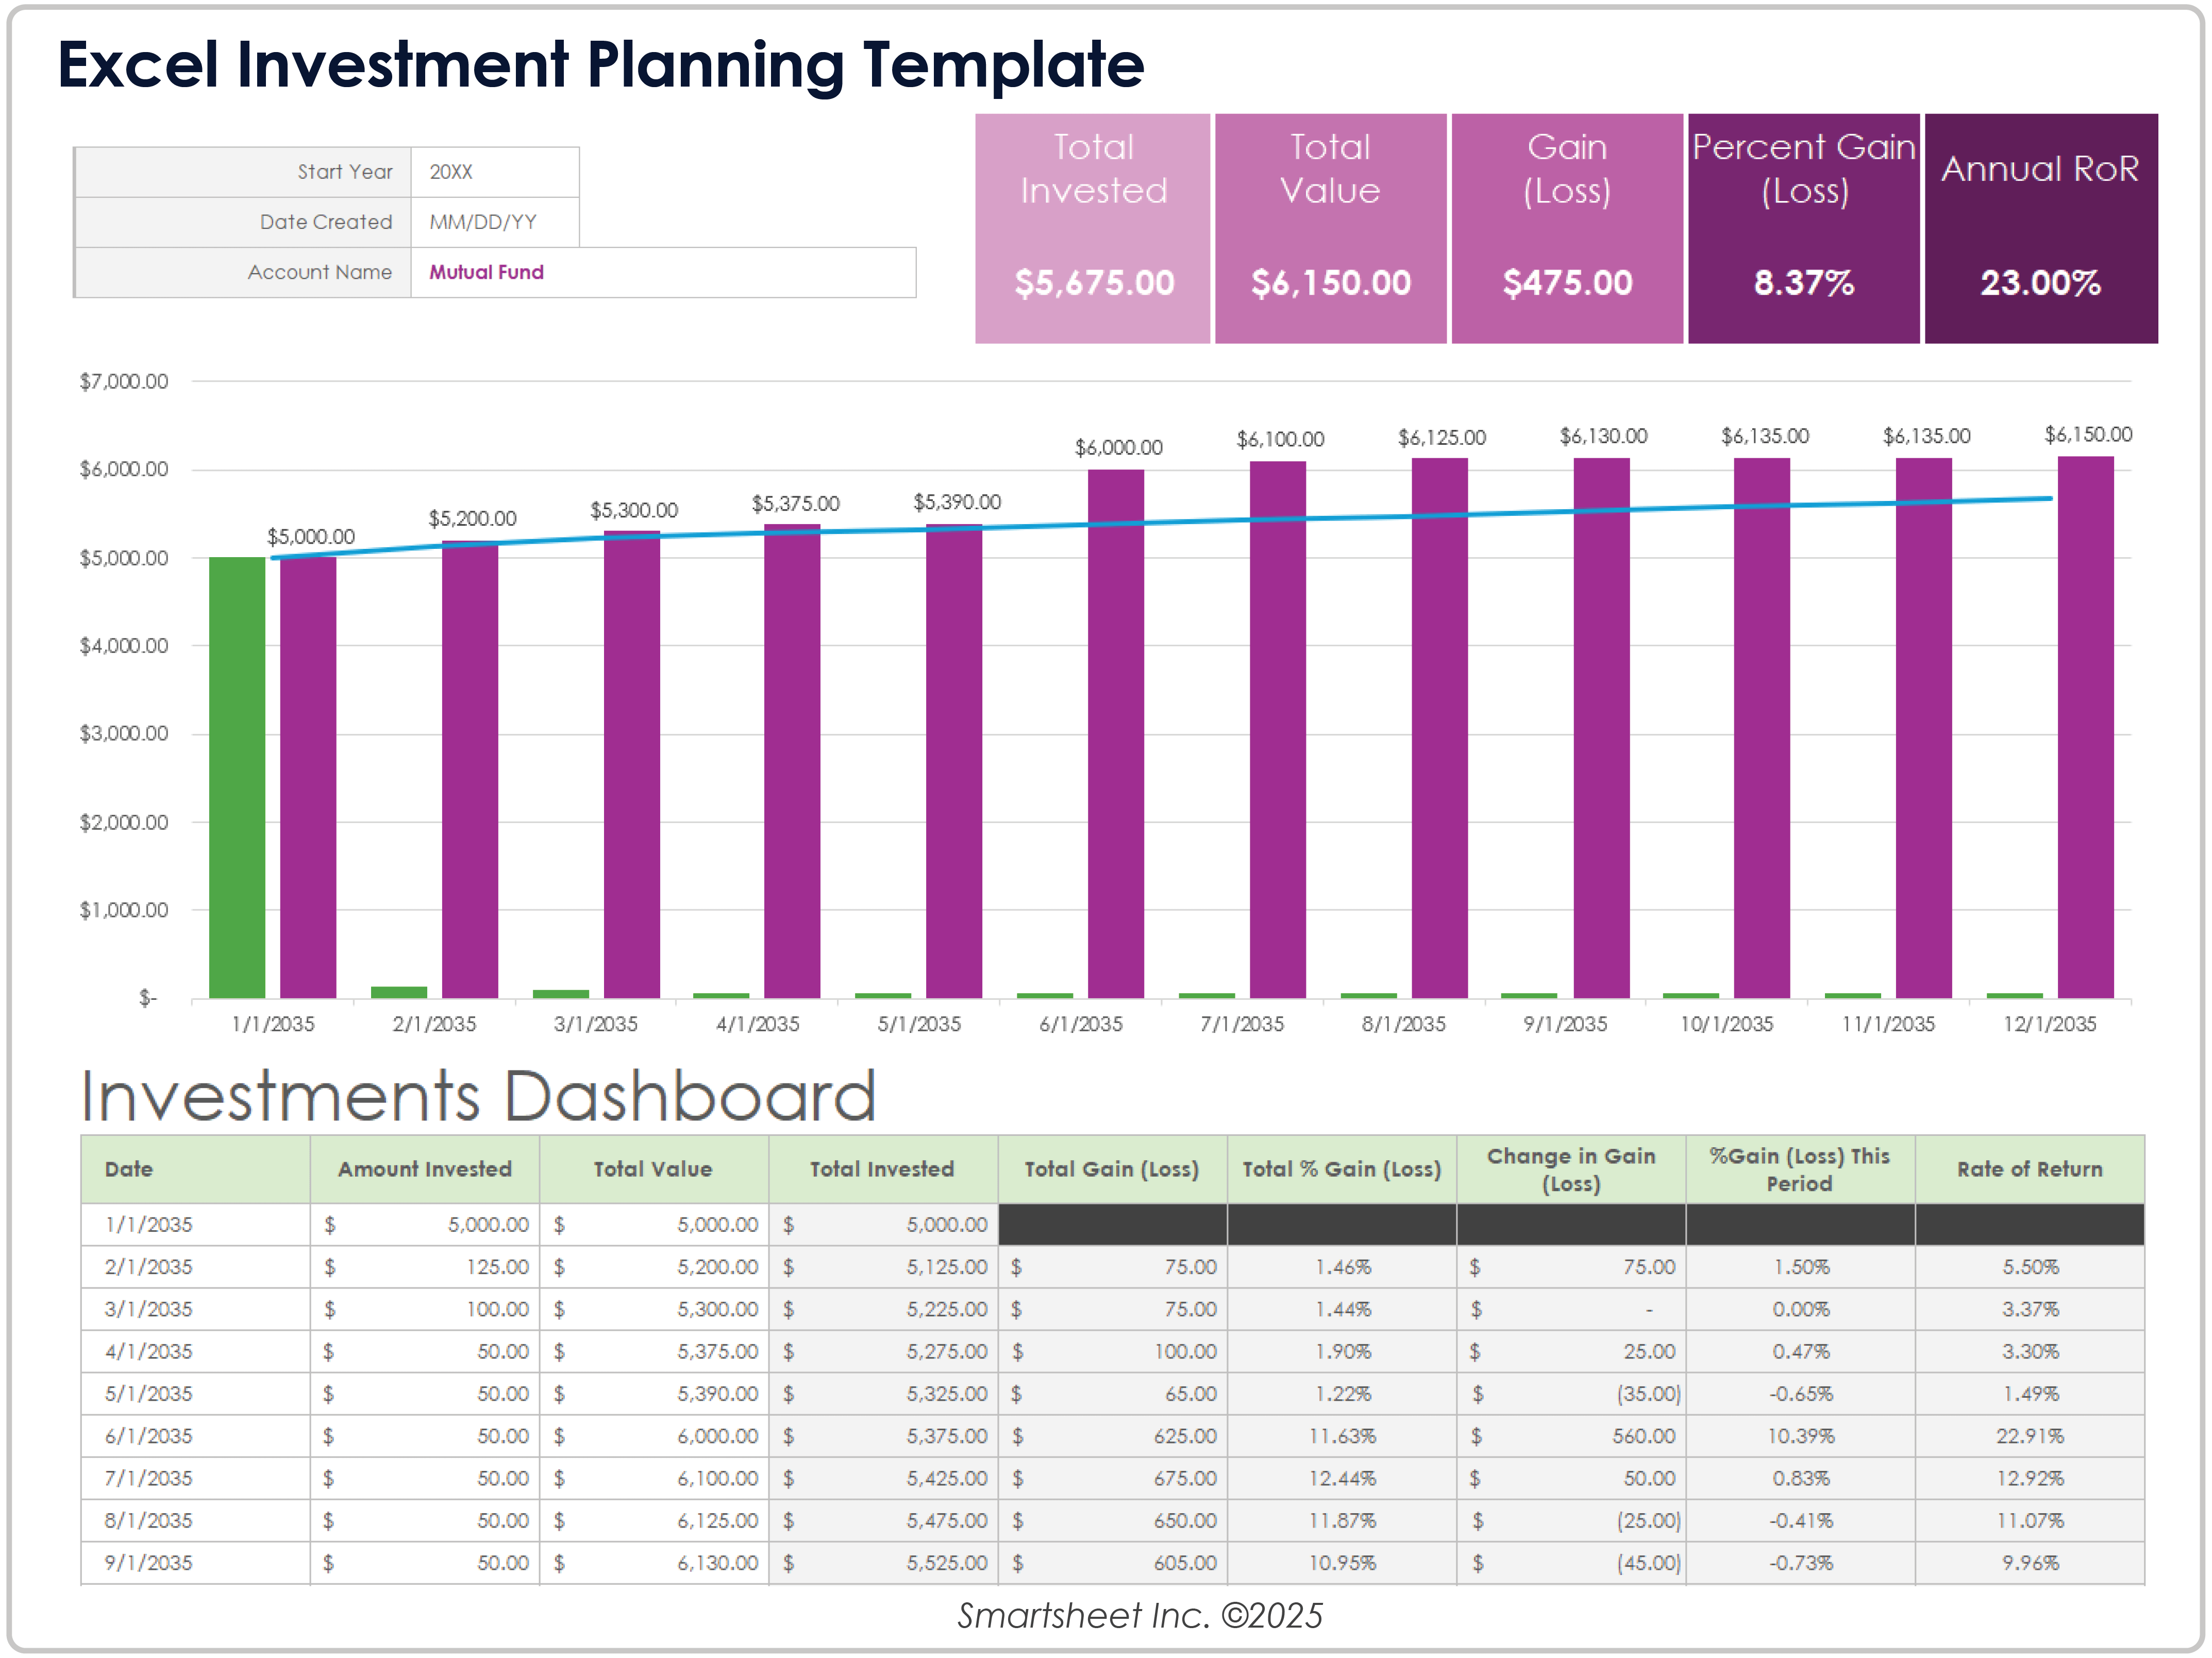
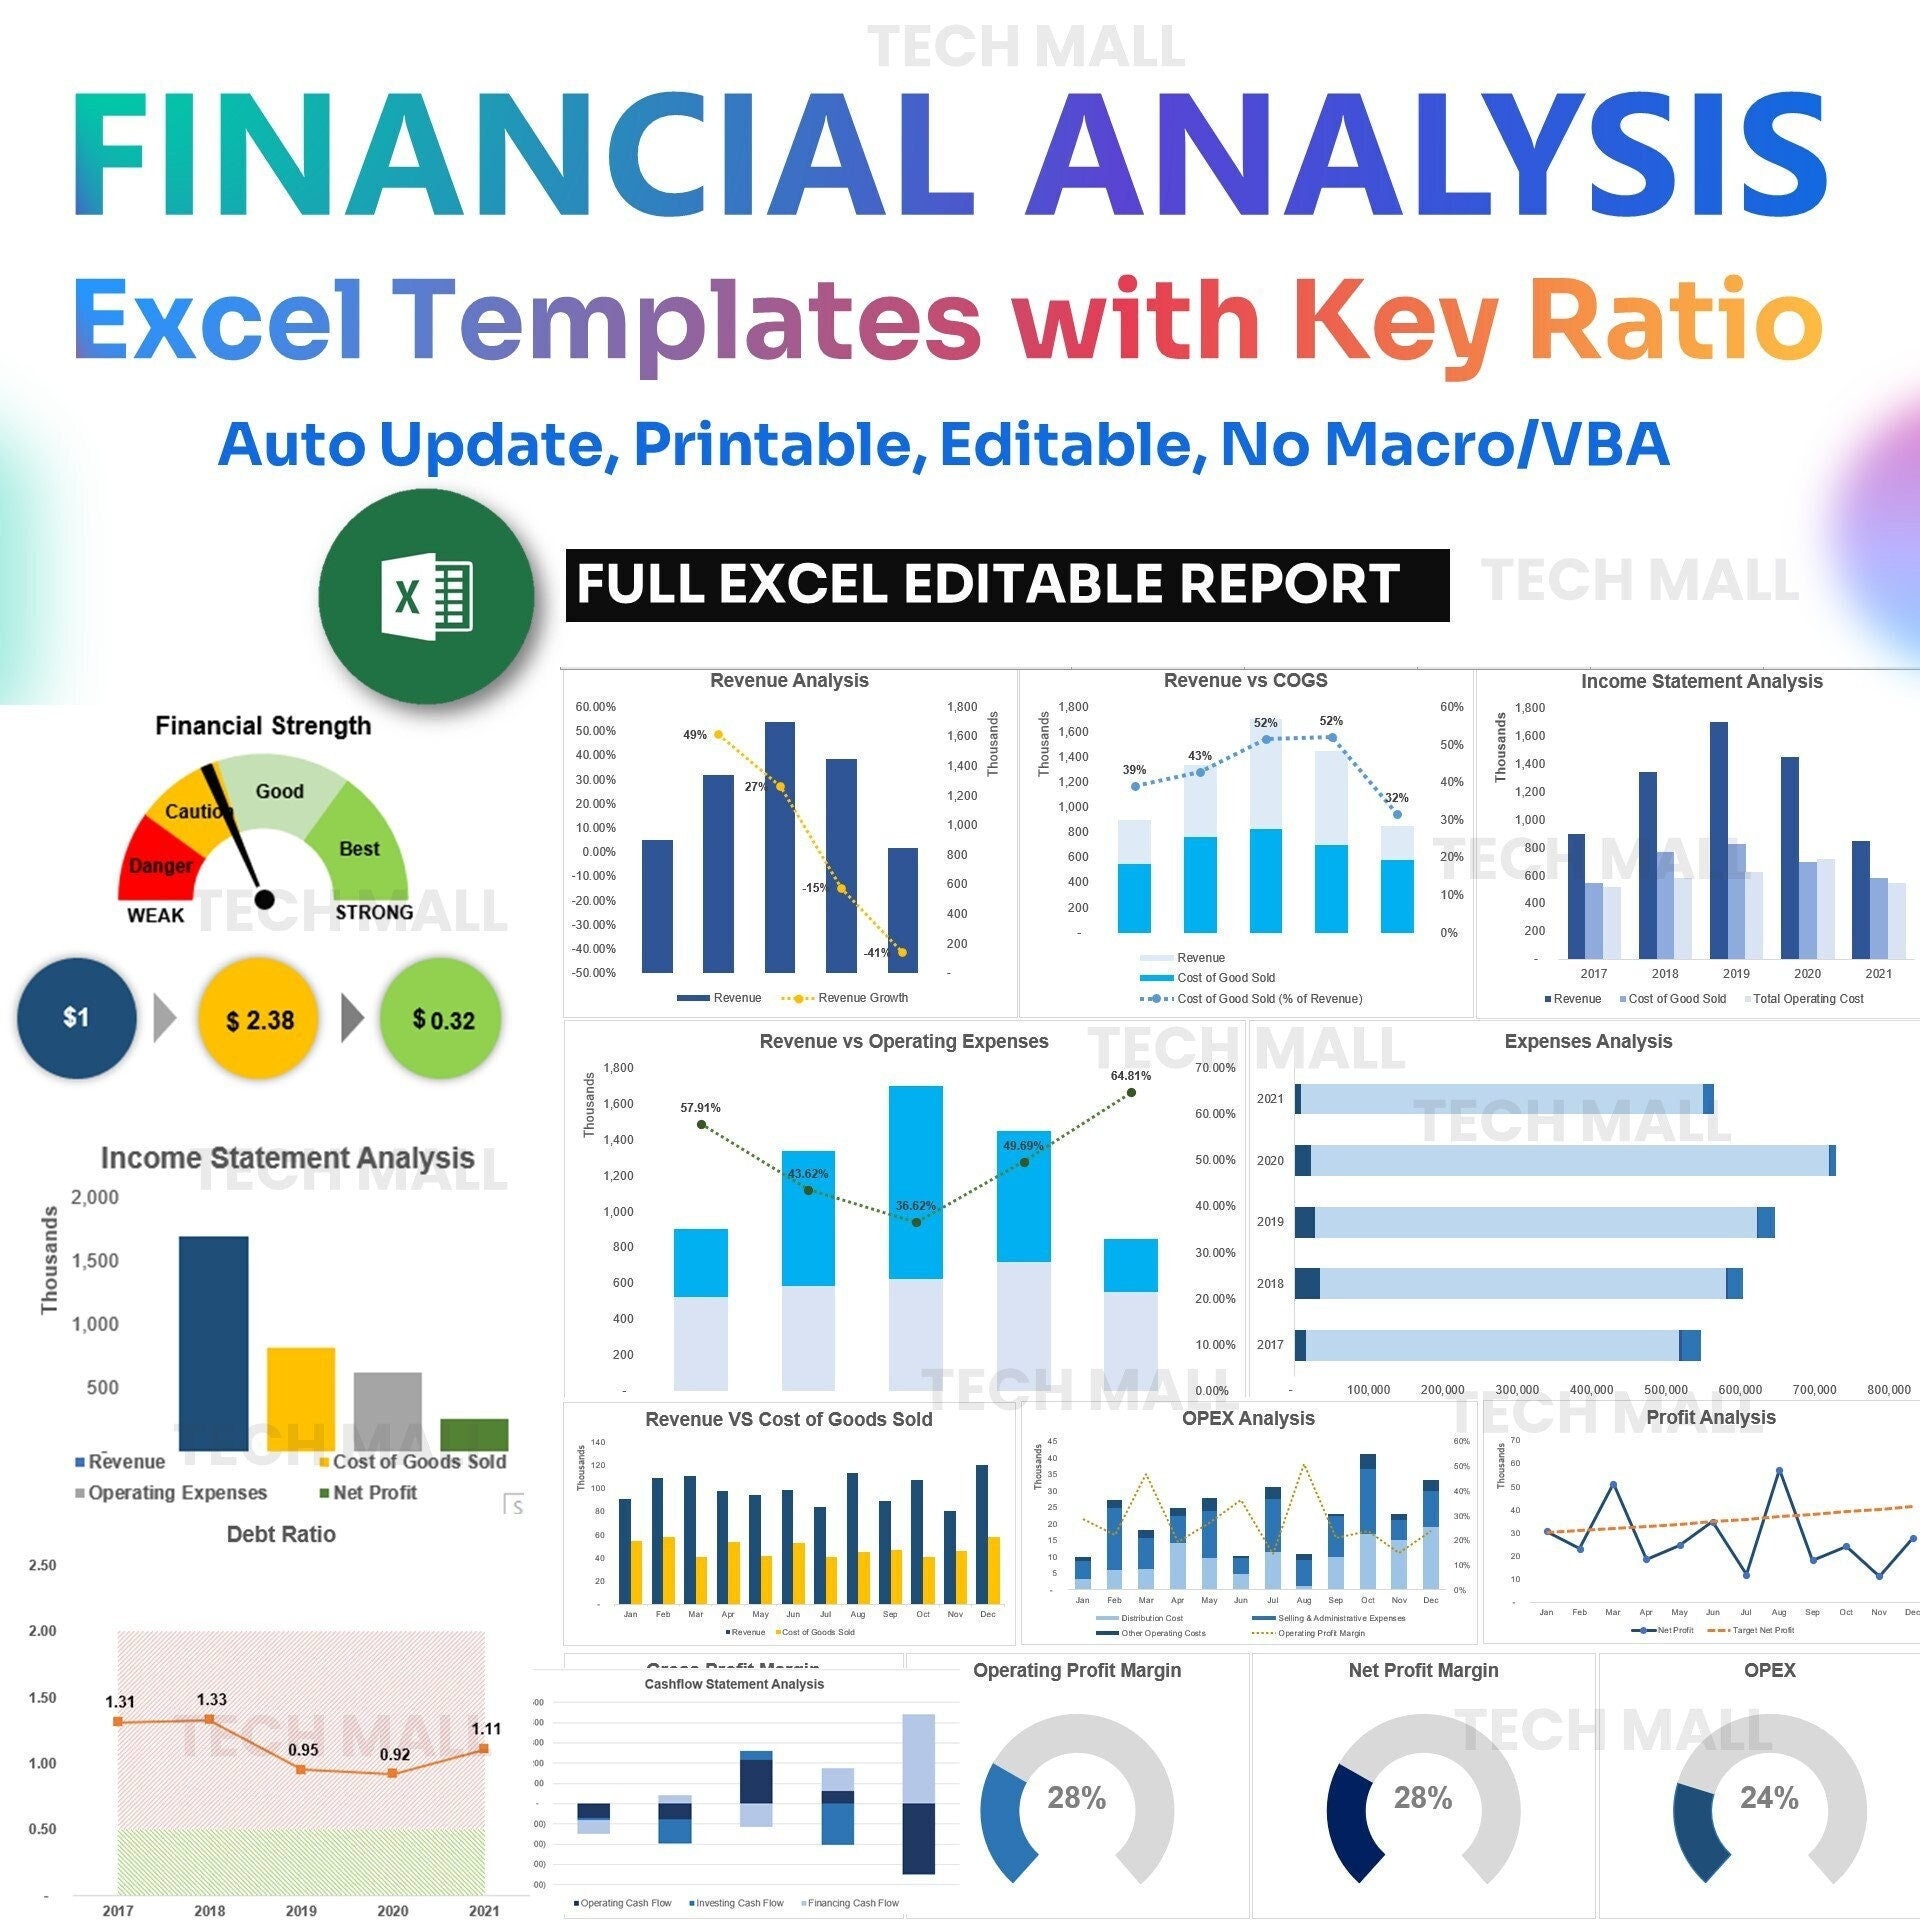
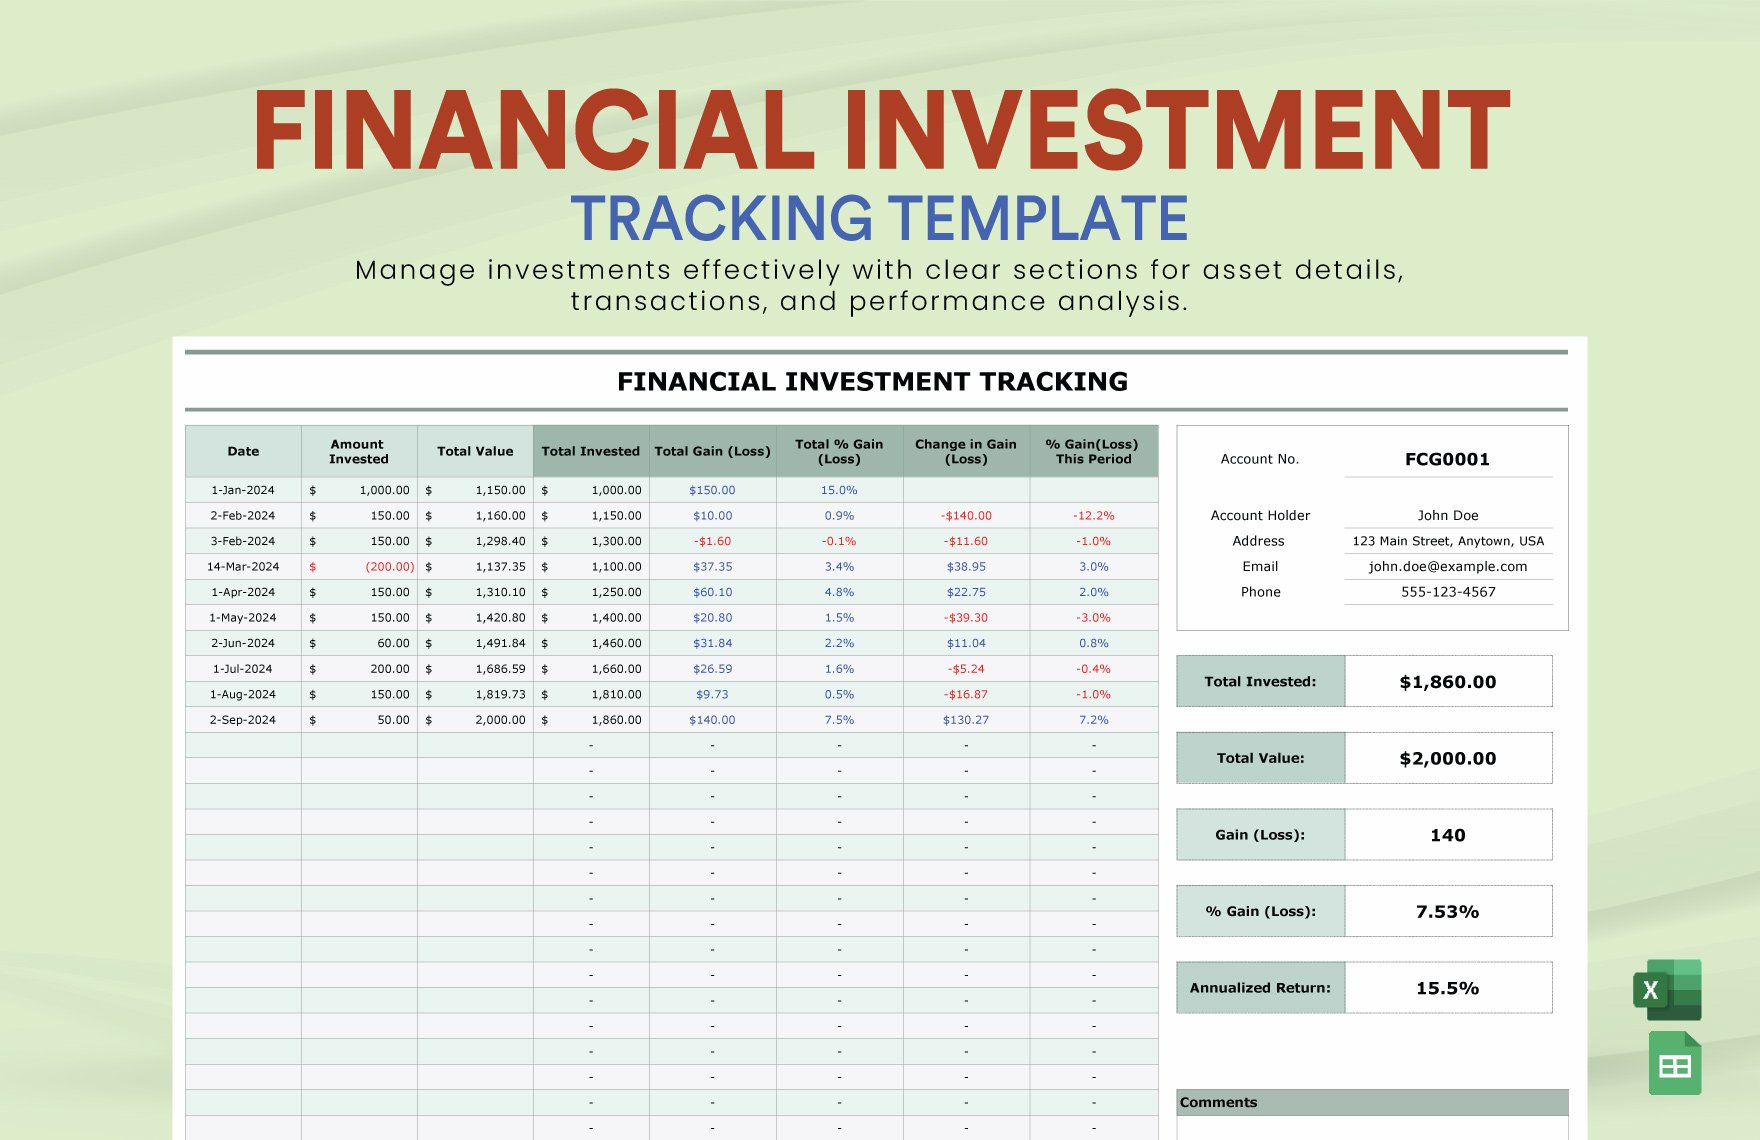
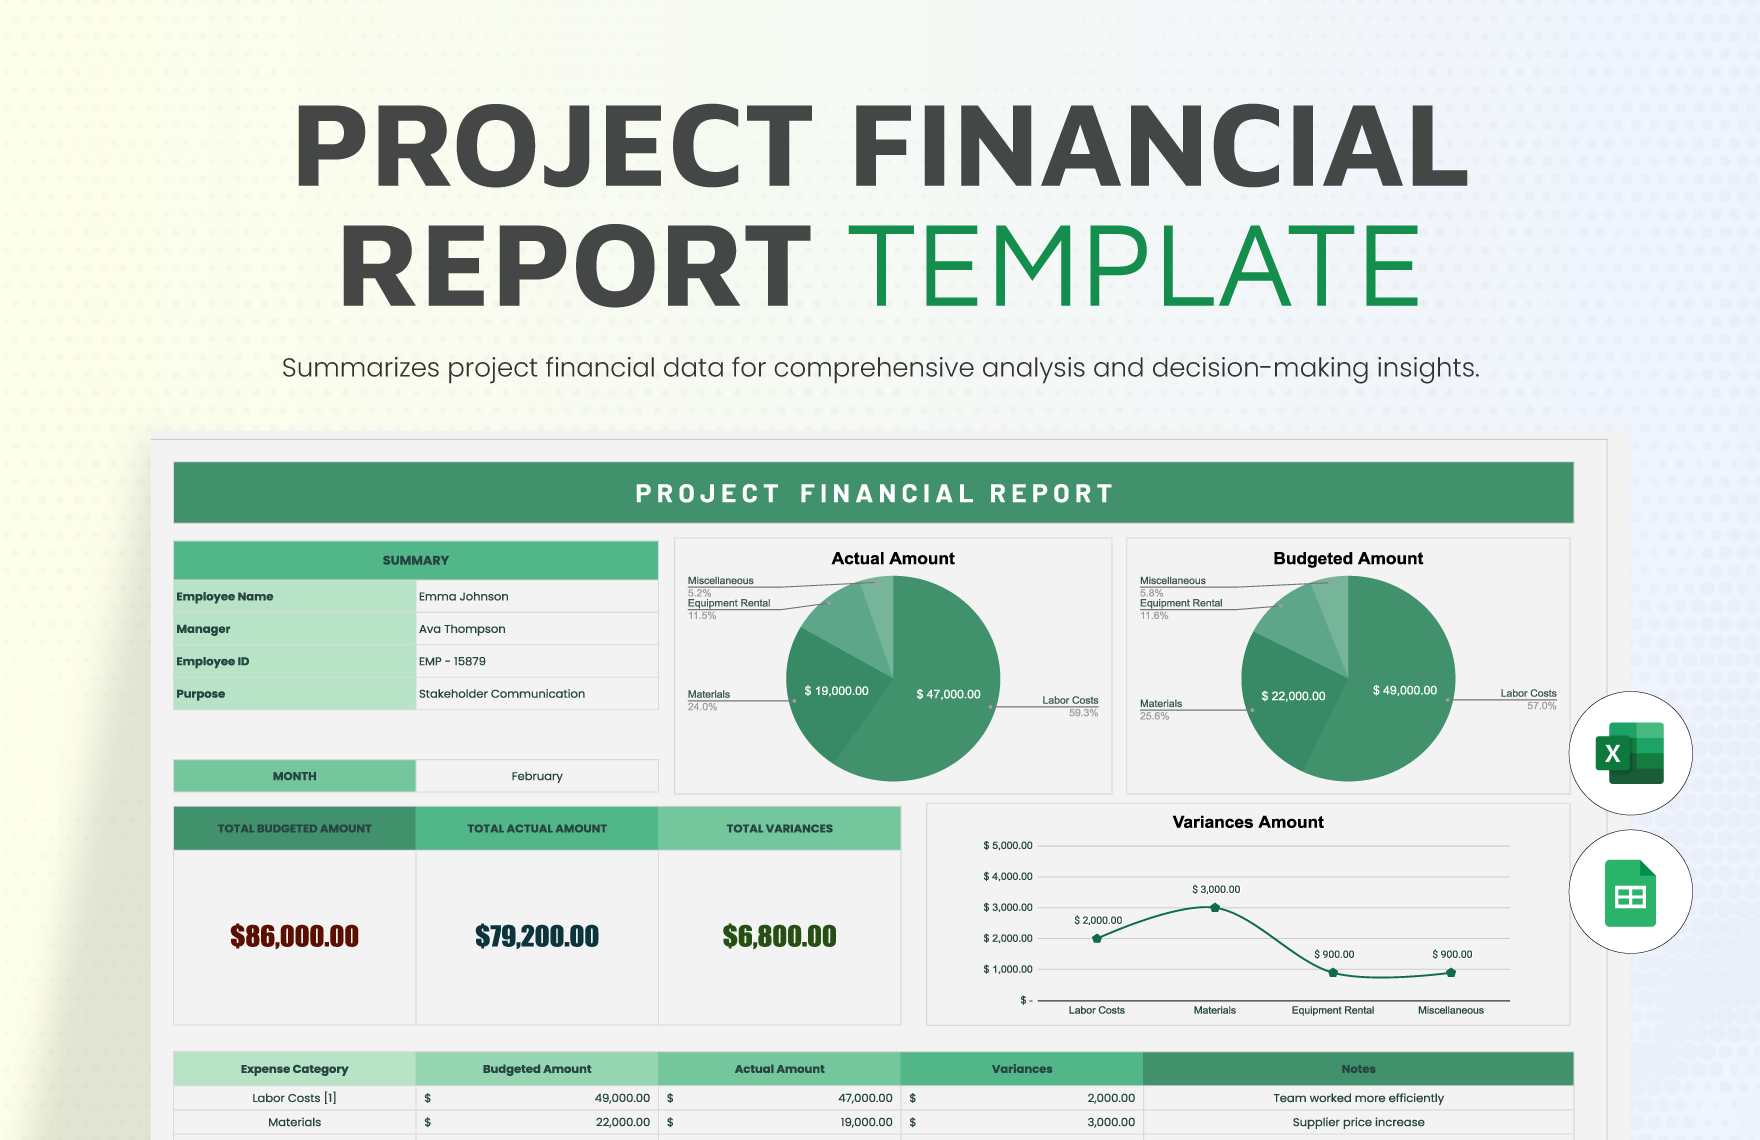
Investment Project Financial Analysis Template is the cornerstone of sound decision‑making for any entrepreneur, CFO, or investor who wants to transform an idea into a profitable reality, and this guide will walk you through everything you need to know to build, use, and master one in both Google Sheets and Excel.
Why a Financial Analysis Template Matters
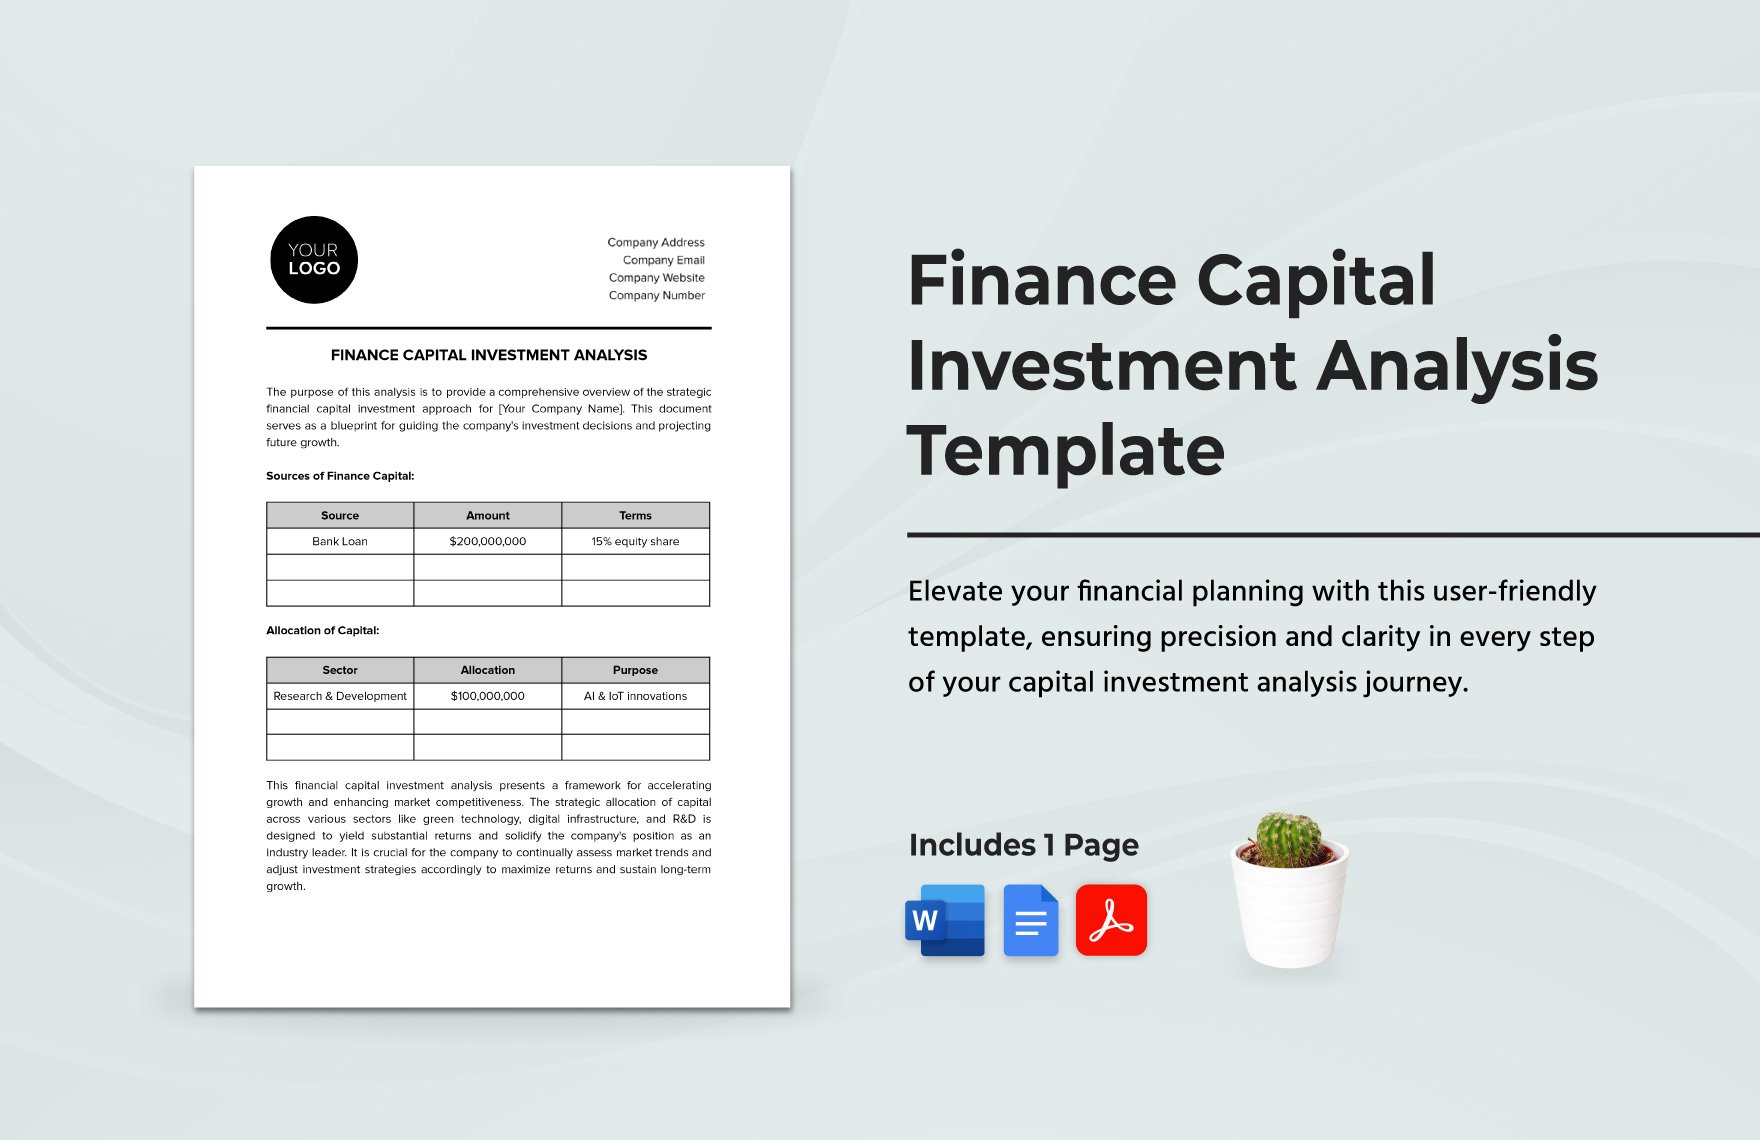
Every investment project, whether it’s a new product line, a real‑estate development, or a tech startup, begins with an assumption that the venture will generate more value than it costs. A well‑designed template captures that assumption in a structured, repeatable format, allowing you to test the hypothesis with hard numbers instead of gut feelings. By centralizing cash‑flow projections, discount rates, and risk factors, the template eliminates the “spreadsheet chaos” that often plagues finance teams and ensures that every stakeholder reviews the same data set.
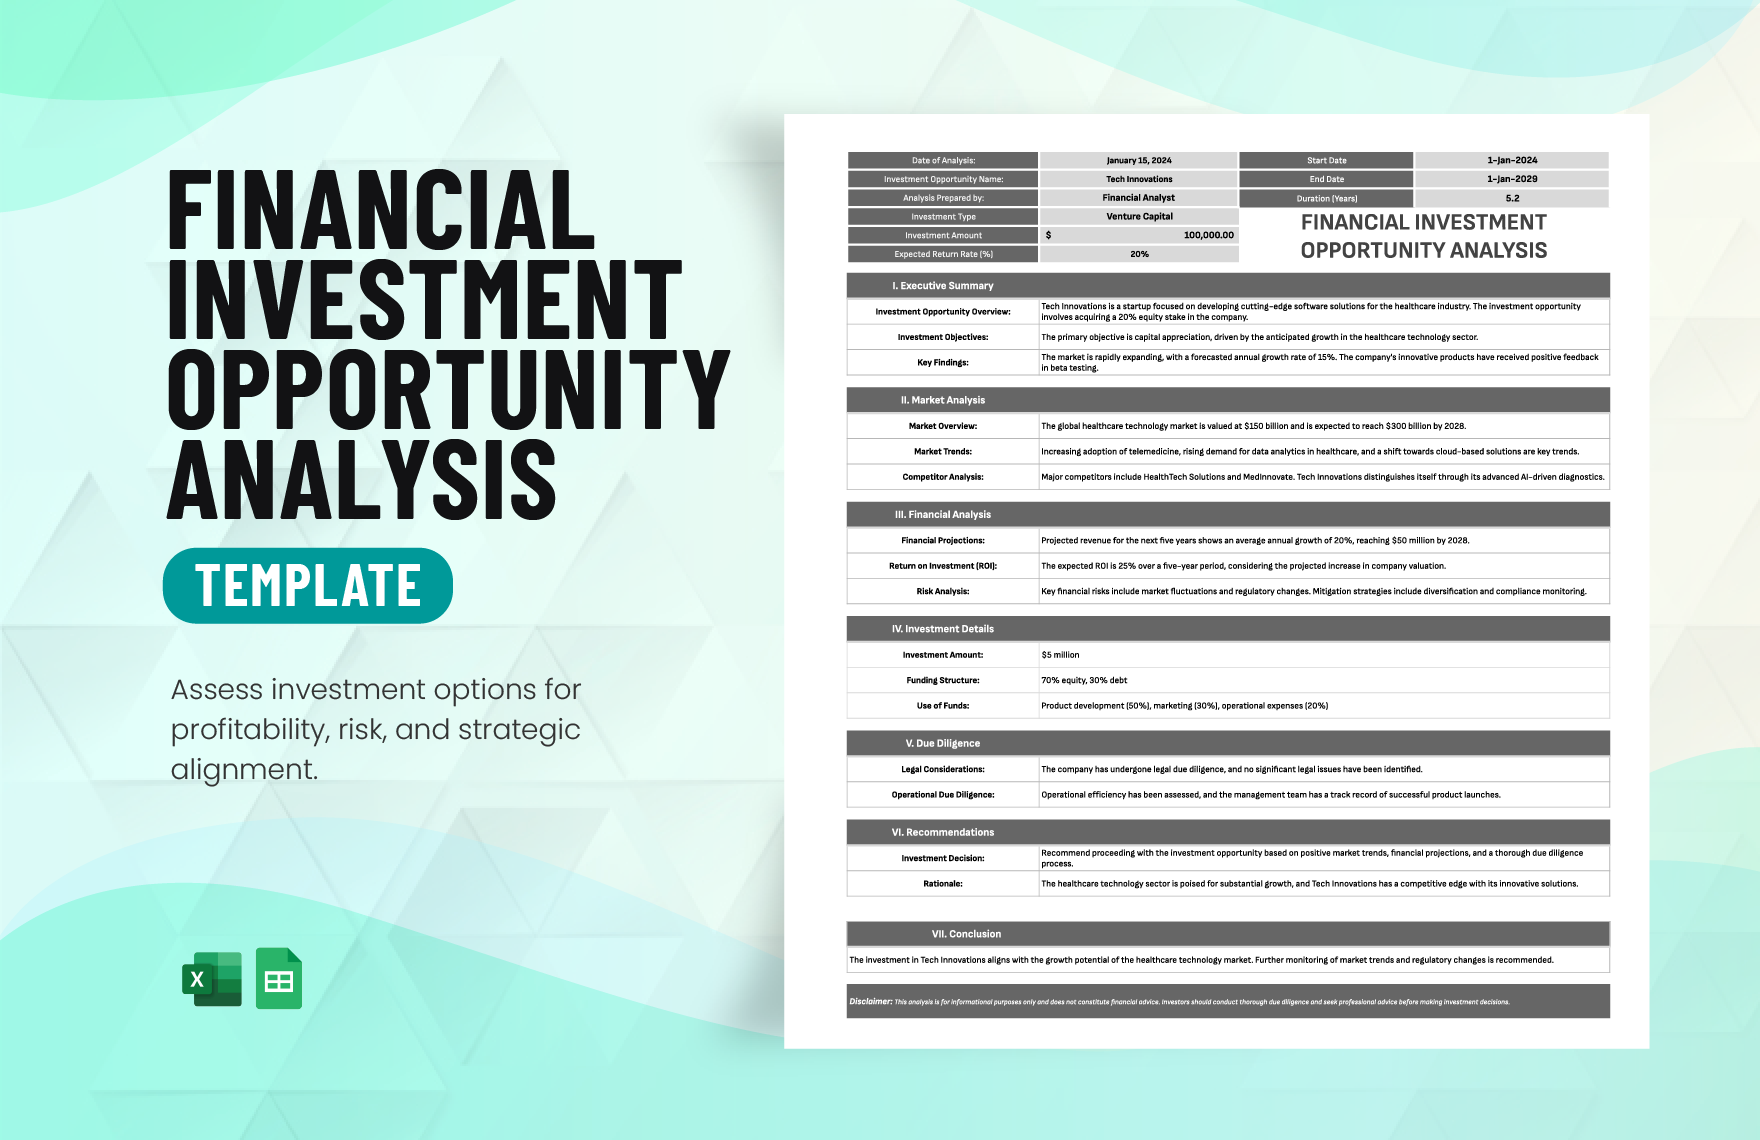
Beyond internal consistency, a robust template also speaks the language of external financiers. Banks, venture capitalists, and angel investors expect to see clear, auditable calculations of Net Present Value (NPV), Internal Rate of Return (IRR), and payback periods. Presenting a polished, formula‑driven document signals professionalism and reduces the due‑diligence time dramatically.
Core Components of an Investment Project Financial Analysis Template
Cash Flow Projections
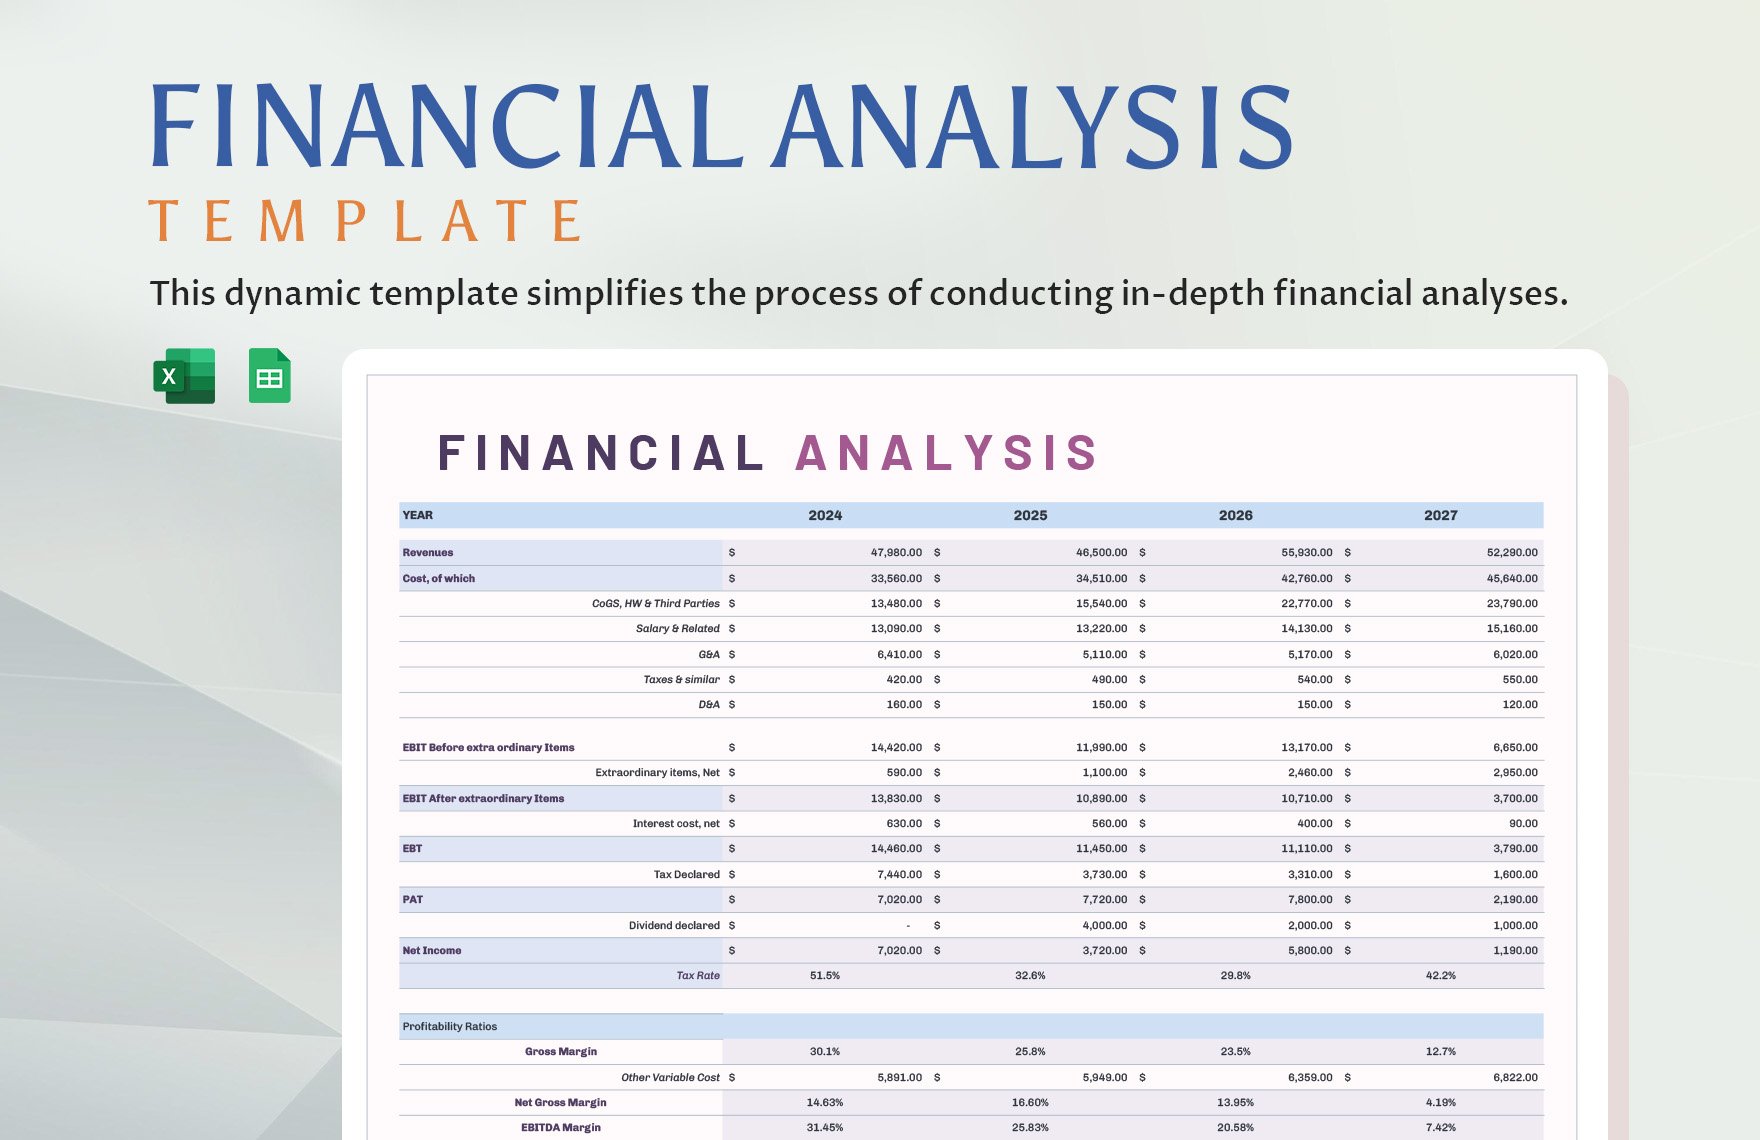
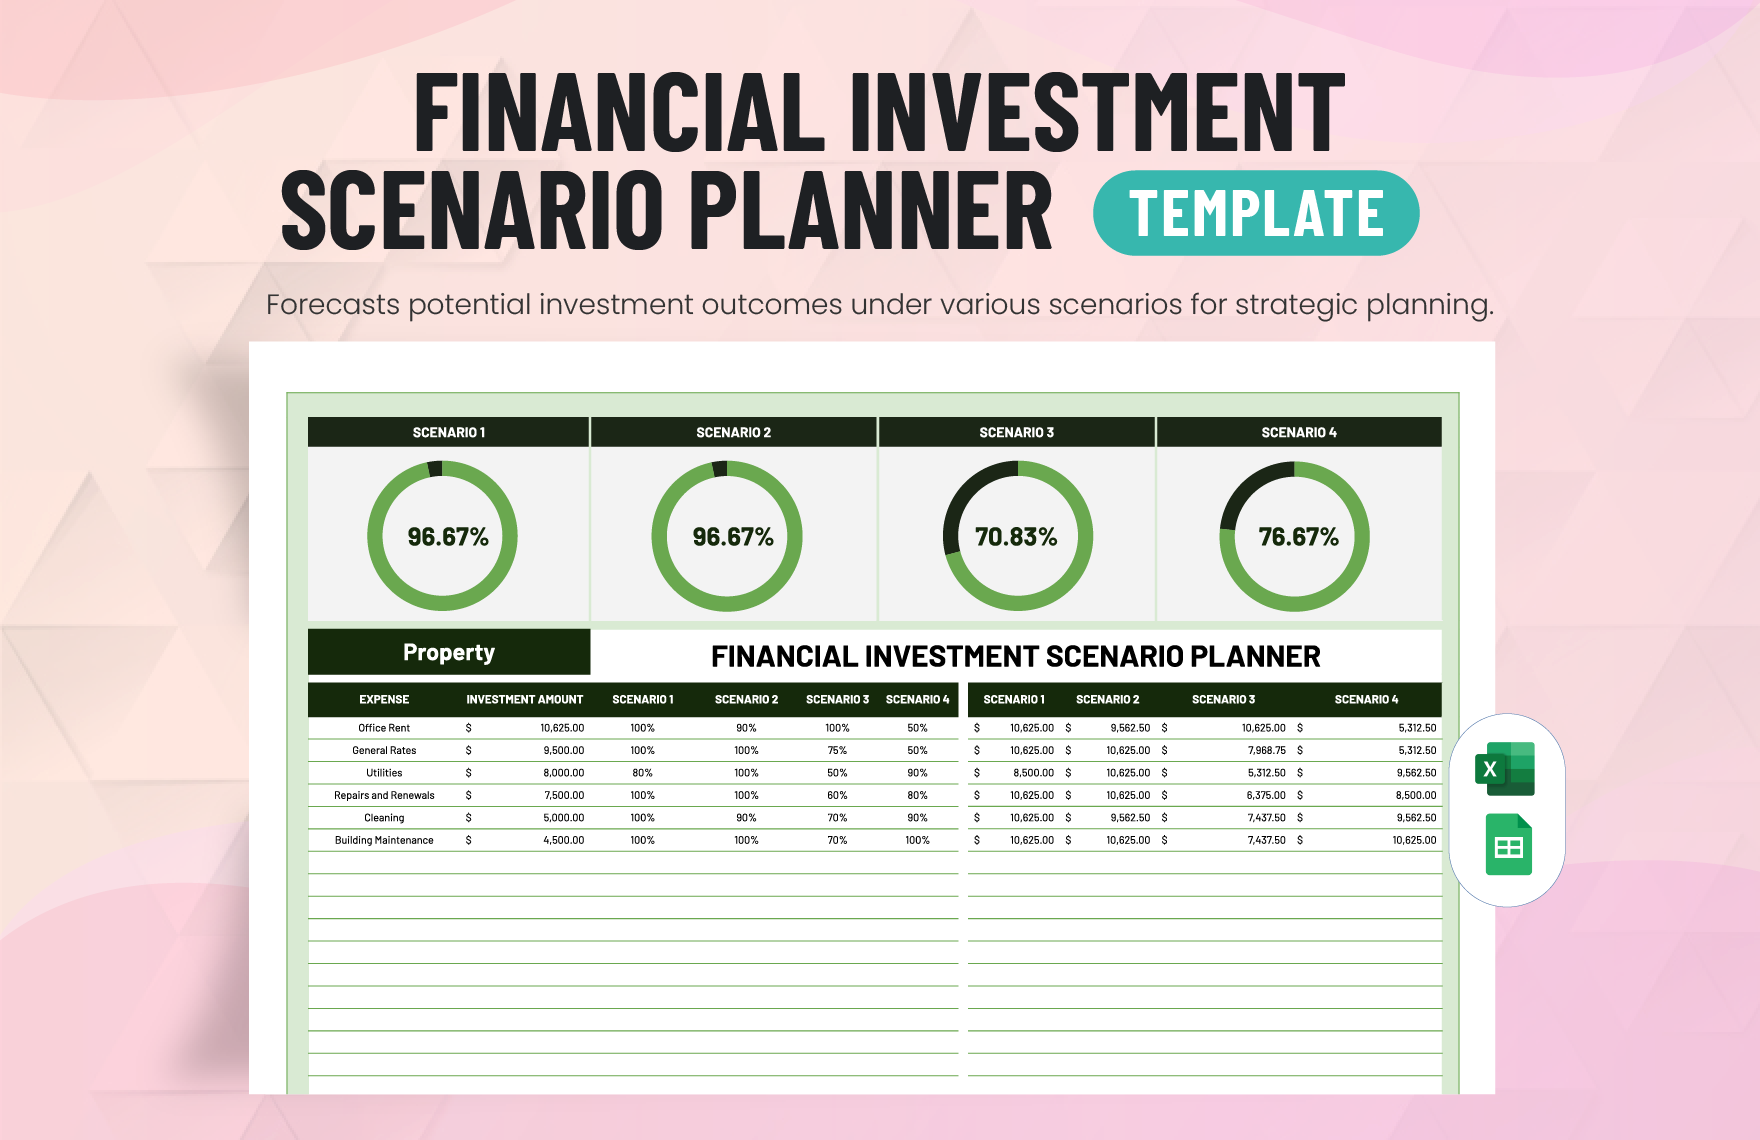
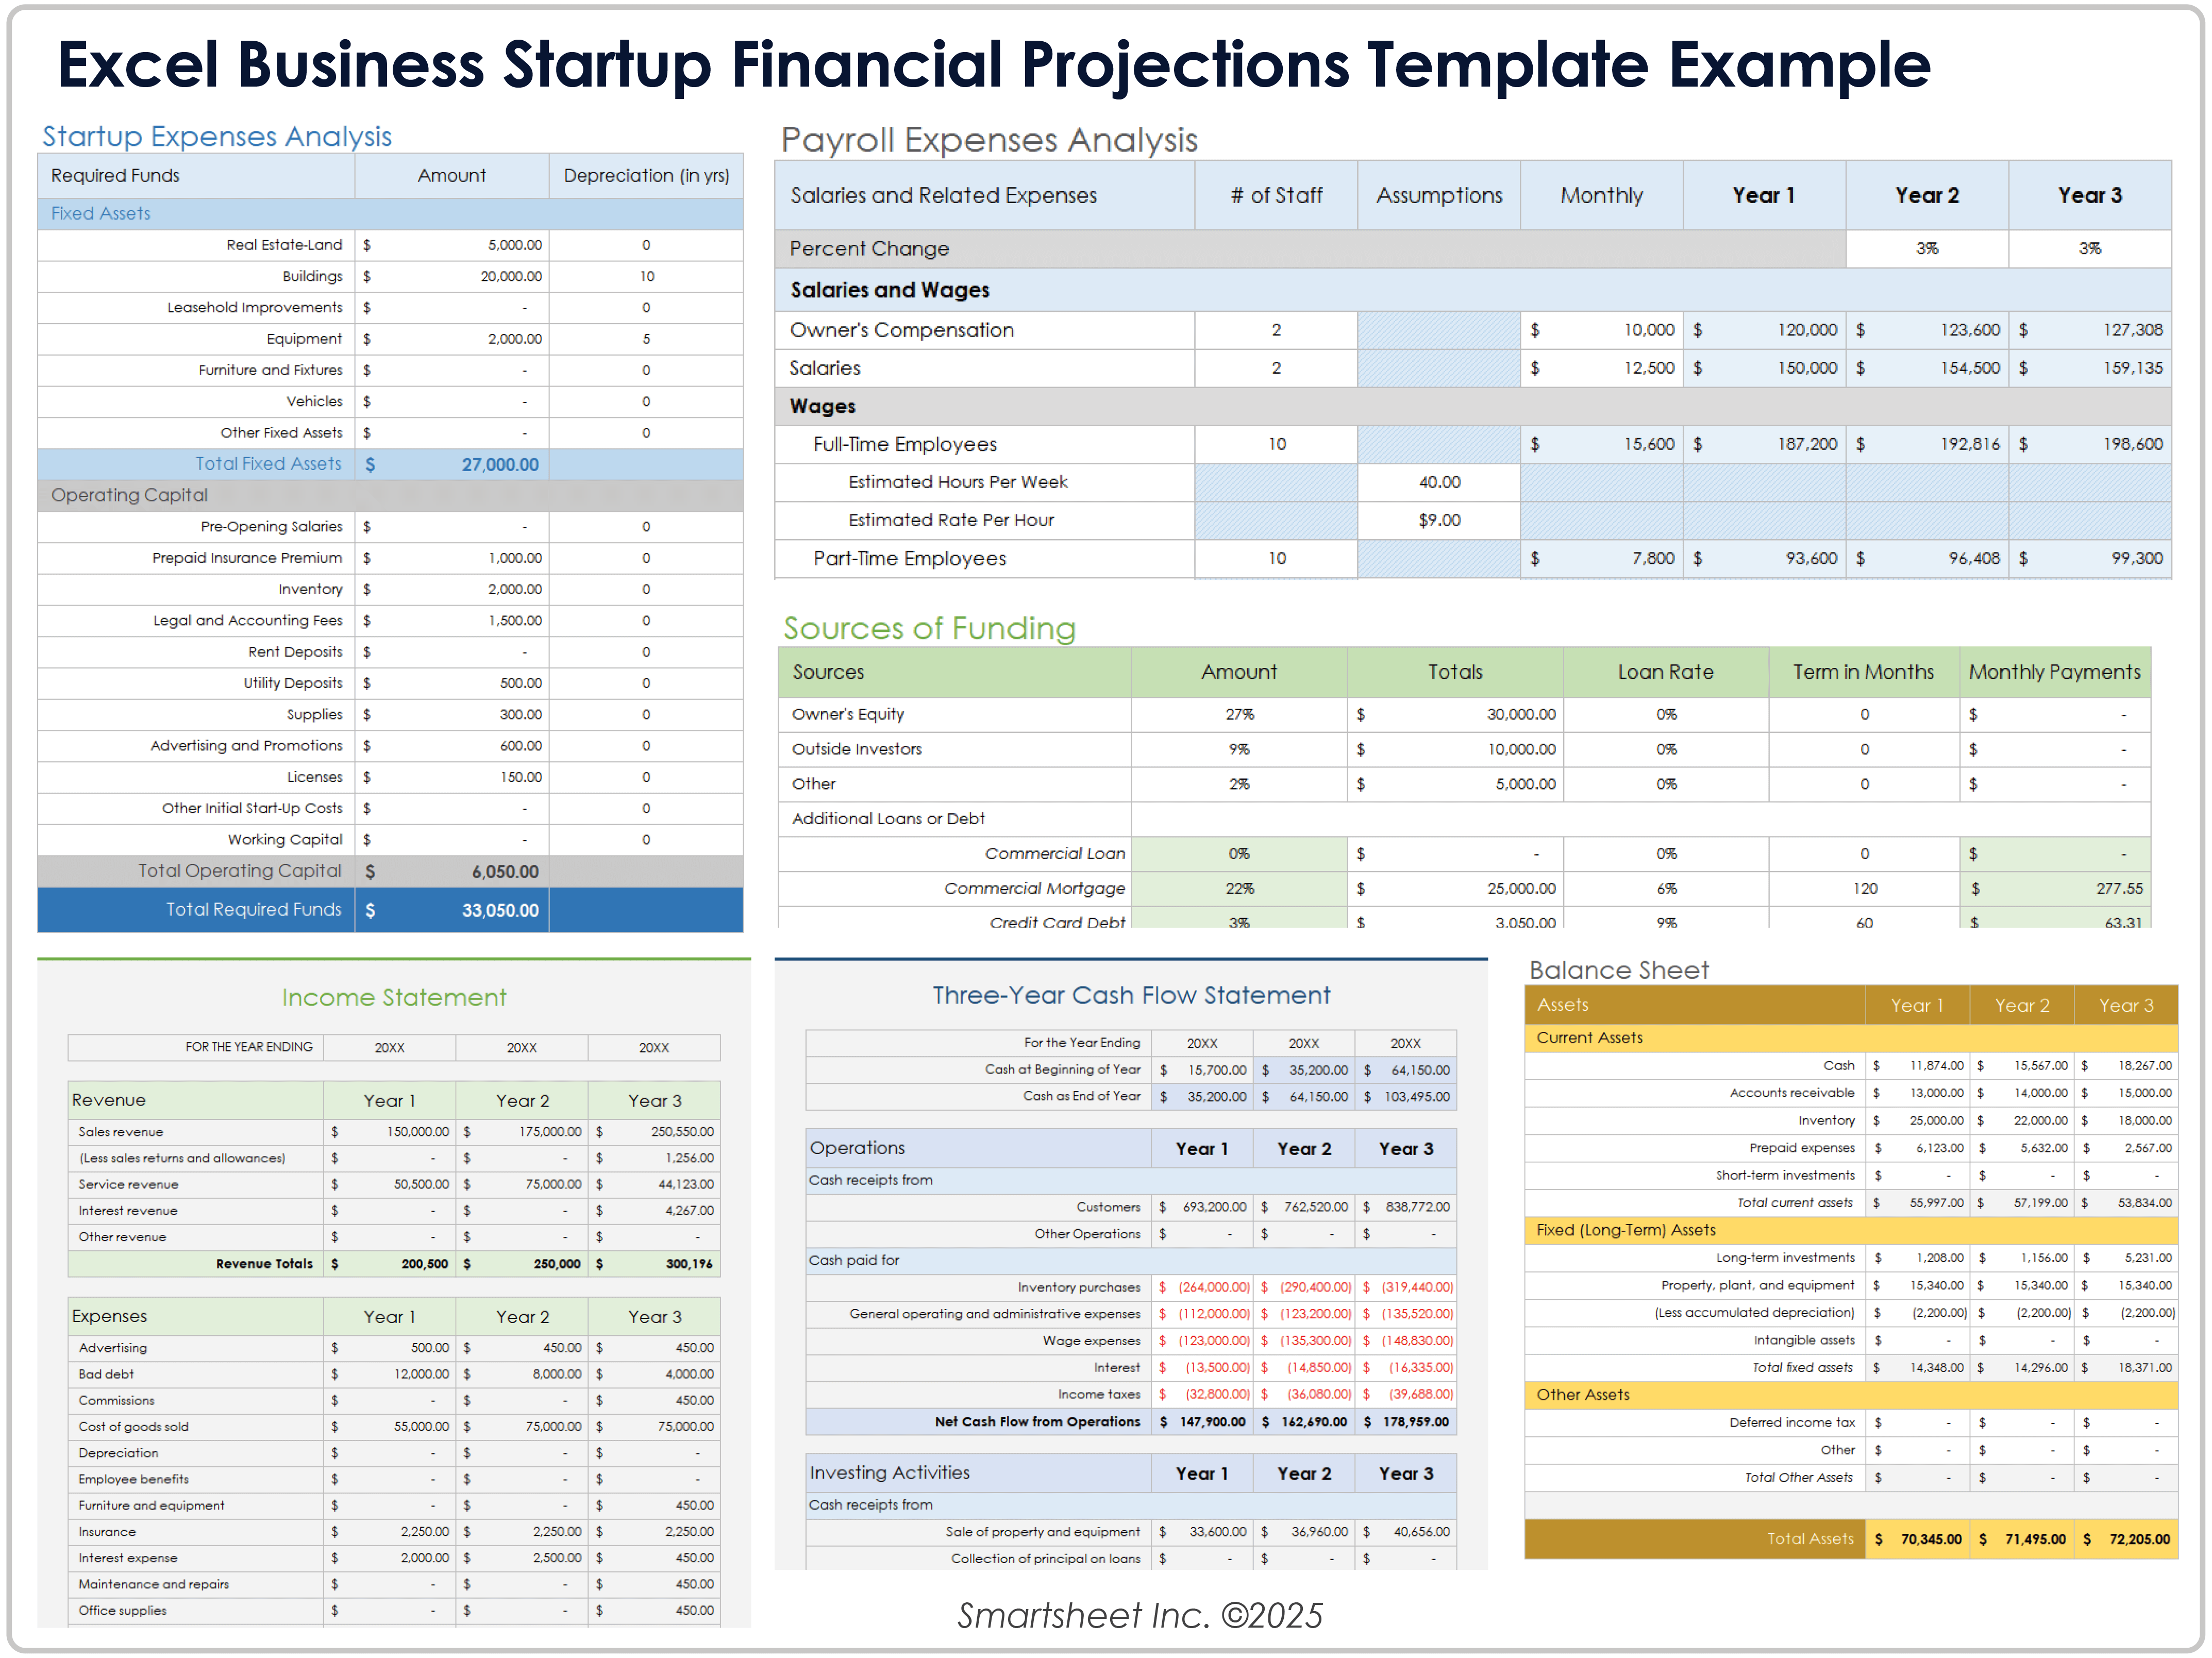
The heart of any financial model is the cash‑flow forecast. Start by breaking down revenue streams and cost categories month‑by‑month for at least the first three years. Include:
- Sales volume assumptions and pricing tiers
- Variable costs directly tied to production or service delivery
- Fixed operating expenses such as rent, utilities, and salaries
- Capital expenditures (CapEx) for equipment or software licenses
- Tax obligations and working‑capital adjustments
By linking each line item to a driver (e.g., units sold, employee headcount), you create a dynamic model that updates automatically when assumptions change.
Discounted Cash Flow (DCF) and Net Present Value (NPV)
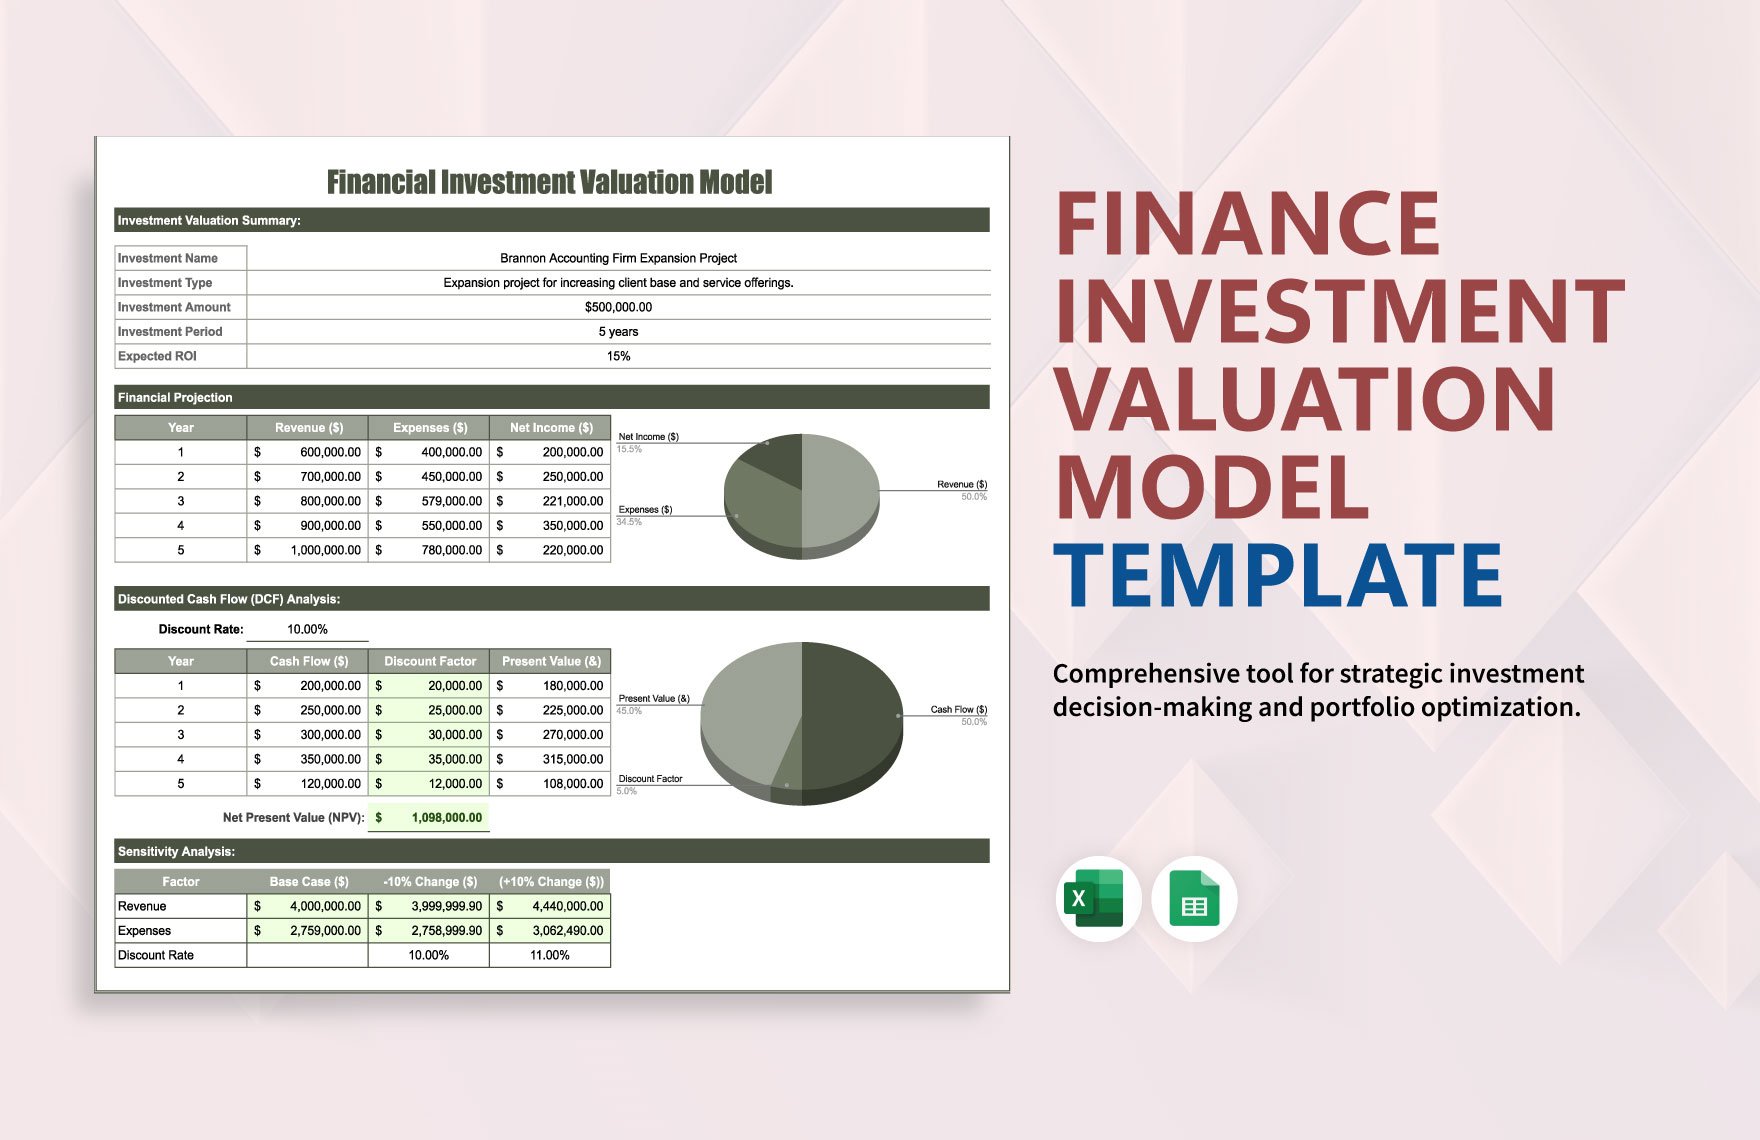
DCF analysis translates future cash flows into today’s dollars, reflecting the time value of money. Your template should include a discount rate—often the weighted average cost of capital (WACC) or a hurdle rate set by investors. Use the Excel or Google Sheets =NPV() function to calculate the present value of the projected cash flows and then subtract the initial outlay to arrive at NPV. A positive NPV indicates that the project is expected to add value.
Internal Rate of Return (IRR) and Payback Period
IRR is the discount rate that makes NPV zero. It provides a quick benchmark: if the IRR exceeds the required return, the project passes the financial test. Most templates include the =IRR() function applied to the cash‑flow series. The payback period—how many months or years it takes to recoup the initial investment—offers a more intuitive measure for non‑financial stakeholders.
Sensitivity and Scenario Analysis
No model is complete without testing how results react to changes in key assumptions. Build data tables that vary discount rates, sales growth, or cost inflation by ±10 % to ±20 %. Use conditional formatting to highlight cells where NPV turns negative or IRR falls below the hurdle rate. This visual cue helps decision‑makers understand the risk envelope at a glance.
Risk Assessment and Mitigation
Quantitative analysis must be complemented by a qualitative risk register. Add a section that lists major risks—market adoption, regulatory changes, supply‑chain disruptions—and assigns probability, impact, and mitigation strategies. Linking each risk to a specific cash‑flow driver (e.g., “supplier price increase” tied to raw‑material cost) creates a clear line of sight between risk and financial outcome.
Building the Template in Google Sheets or Excel

Setting Up the Workbook
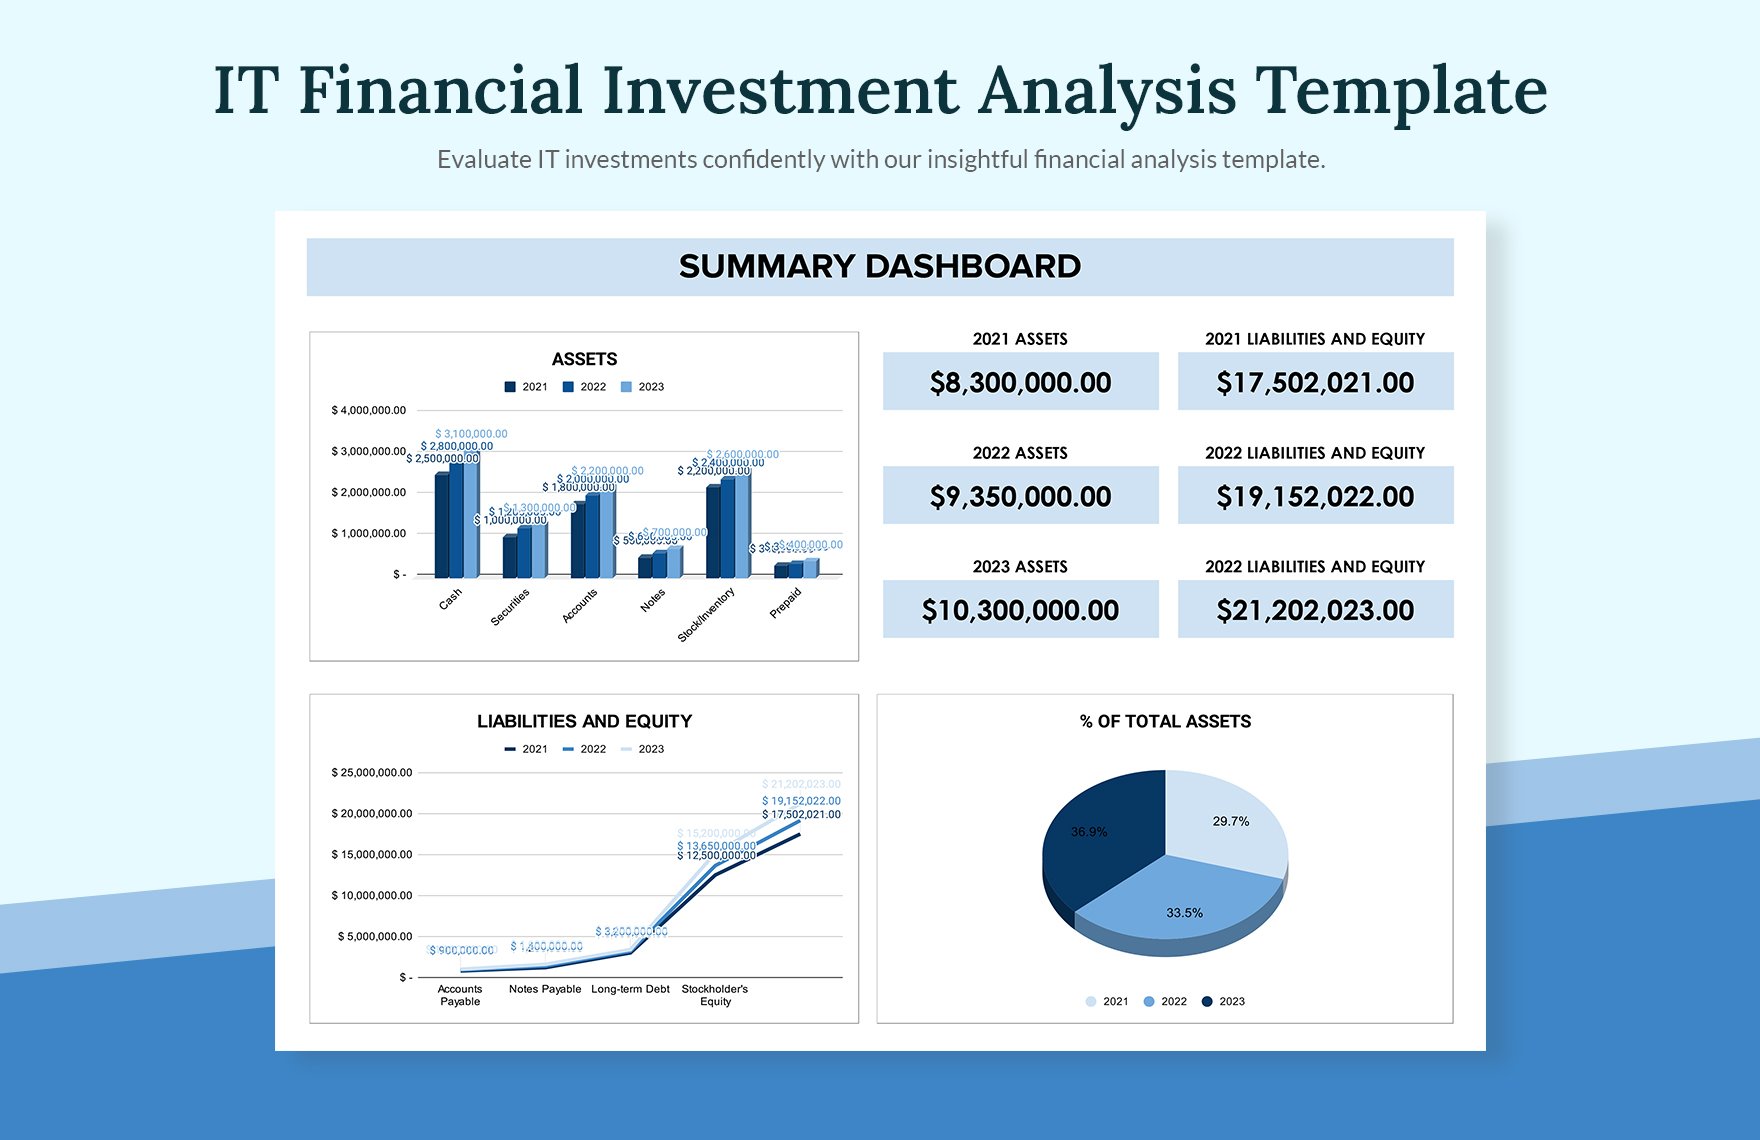
Start with a clean workbook that separates inputs, calculations, and outputs. Create distinct sheets named “Assumptions,” “Cash Flow,” “DCF,” and “Dashboard.” In the Assumptions sheet, place all variable inputs—growth rates, discount rates, and cost assumptions—in clearly labeled cells. Use named ranges (e.g., RevenueGrowth) to make formulas readable and easier to audit.
Using Formulas and Functions
Leverage built‑in financial functions to keep the model transparent:
=PMT()for loan amortization schedules=XNPV()and=XIRR()for cash flows that occur at irregular intervals=IFERROR()to trap division‑by‑zero errors in sensitivity tables=ARRAYFORMULA()(Google Sheets) or=INDEX()(Excel) for dynamic range expansion when adding new periods
Document each formula with an inline comment (Ctrl+Shift+K in Excel) or a separate “Notes” column so future users understand the logic without digging through cell references.
Data Validation and Protection
Prevent accidental overwrites by applying data validation rules to the Assumptions sheet. Restrict numeric cells to positive numbers, limit percentages between 0 % and 100 %, and use drop‑down lists for categorical inputs like “Region” or “Currency.” Protect calculation sheets while leaving the Dashboard viewable for executives who need only the final outputs.
Real‑World Example: Launching a Tech Startup
Assumptions
Imagine a SaaS company planning to launch a new AI‑driven analytics platform. Key assumptions might include:
- Initial development cost: $500,000
- Monthly subscription price: $49 per user
- Year‑1 user acquisition: 5,000 users growing 40 % YoY
- Churn rate: 5 % monthly
- Variable cost per user: $10 (hosting, support)
- Fixed operating expenses: $120,000 annually
- Discount rate (WACC): 12 %
Calculations
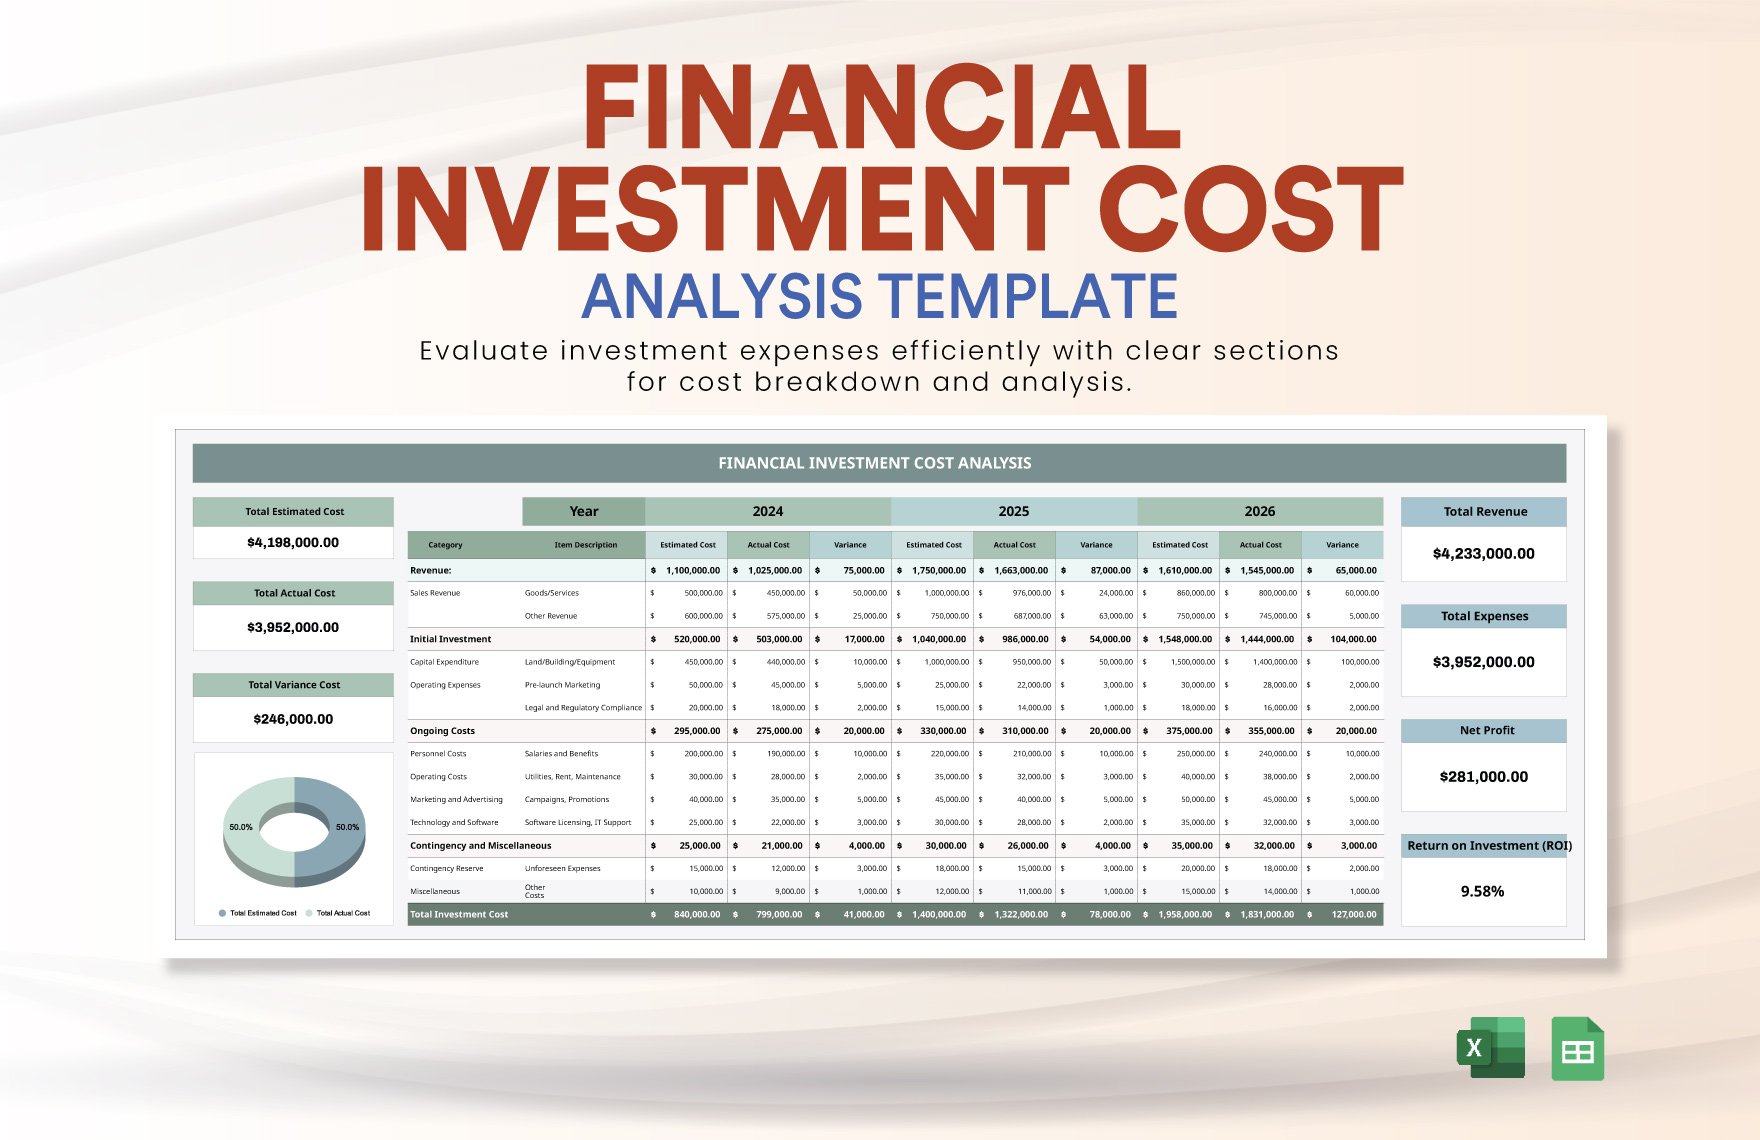
Using the template, the cash‑flow sheet projects revenue as Users × Price and subtracts variable costs and churn‑adjusted attrition. Capital expenditures are entered as a lump‑sum outflow in month 0. The DCF sheet applies the 12 % discount rate to each month’s net cash flow, yielding an NPV of $1.2 million after three years—well above the initial outlay.
IRR comes out at 28 %, indicating a strong return relative to the hurdle rate. Sensitivity analysis shows that even if user growth falls to 25 % YoY, NPV remains positive, though IRR drops to 19 %.
Decision Insights
The model highlights two critical levers: user acquisition cost and churn rate. By allocating additional marketing budget to reduce churn by 1 % point, the NPV improves by $200,000. Conversely, a 10 % increase in hosting costs erodes NPV by $150,000. These insights guide the startup’s strategic focus on retention programs and negotiating better cloud contracts.
Tips for Customizing and Maintaining the Template
Automating Updates
Integrate Google Finance functions (=GOOGLEFINANCE()) or Excel’s data connections to pull live exchange rates, inflation indices, or market benchmarks. This ensures your discount rate and cost assumptions stay current without manual entry.
Collaborating with Stakeholders
Use Google Sheets’ comment feature or Excel’s co‑authoring mode to allow finance, sales, and operations teams to suggest changes directly on the Assumptions sheet. Set up a version‑control log that records who changed what and when, preserving auditability for compliance purposes.
Periodic Review
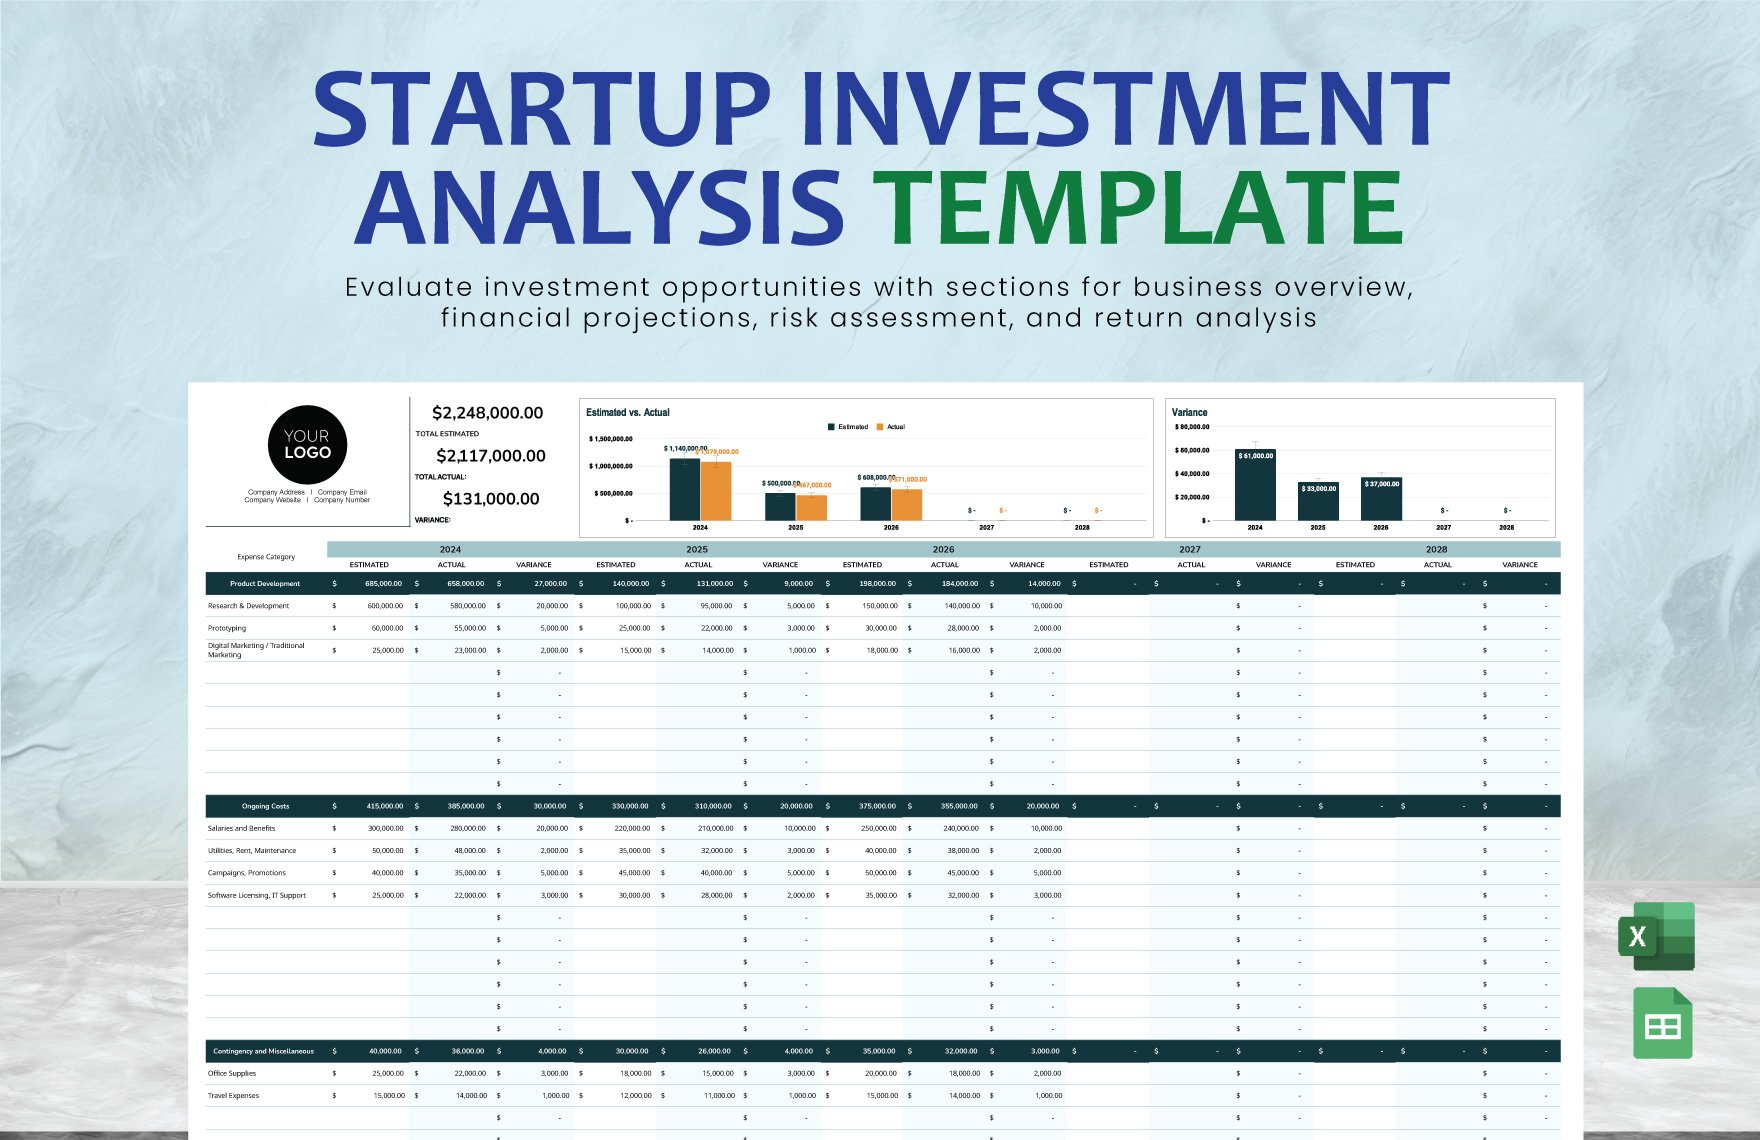
Schedule quarterly “model health checks” to verify that actual performance aligns with forecasts. Update variance analysis tables to capture gaps and adjust future assumptions accordingly. This continuous improvement loop keeps the template relevant as the business evolves.
Common Mistakes to Avoid
Even seasoned analysts can stumble. Here are pitfalls that diminish the value of your template:
- Hard‑coding numbers inside formulas—always reference input cells so changes propagate automatically.
- Ignoring inflation—adjust future costs and revenues for price level changes to avoid overly optimistic NPV.
- Overcomplicating the model—extra layers of detail can obscure the core insights and make maintenance painful.
- Failing to test edge cases—run stress scenarios such as zero growth or extreme cost spikes to see how the model behaves.
- Neglecting documentation—without clear notes, new team members will struggle to understand assumptions, leading to errors.
Conclusion
A meticulously crafted Investment Project Financial Analysis Template empowers you to transform speculative ideas into data‑driven investment decisions. By incorporating cash‑flow forecasting, DCF calculations, IRR, sensitivity testing, and risk assessment into a single, user‑friendly workbook, you create a single source of truth that speaks to both finance professionals and external investors. Building the template with clear input segregation, robust formulas, and built‑in protection ensures accuracy and scalability, while real‑world examples demonstrate how the model can uncover actionable insights that shape strategy. Regular updates, collaborative reviews, and vigilant avoidance of common errors keep the tool sharp over the life of the project. Armed with this template, you are ready to evaluate any venture with confidence, clarity, and credibility.