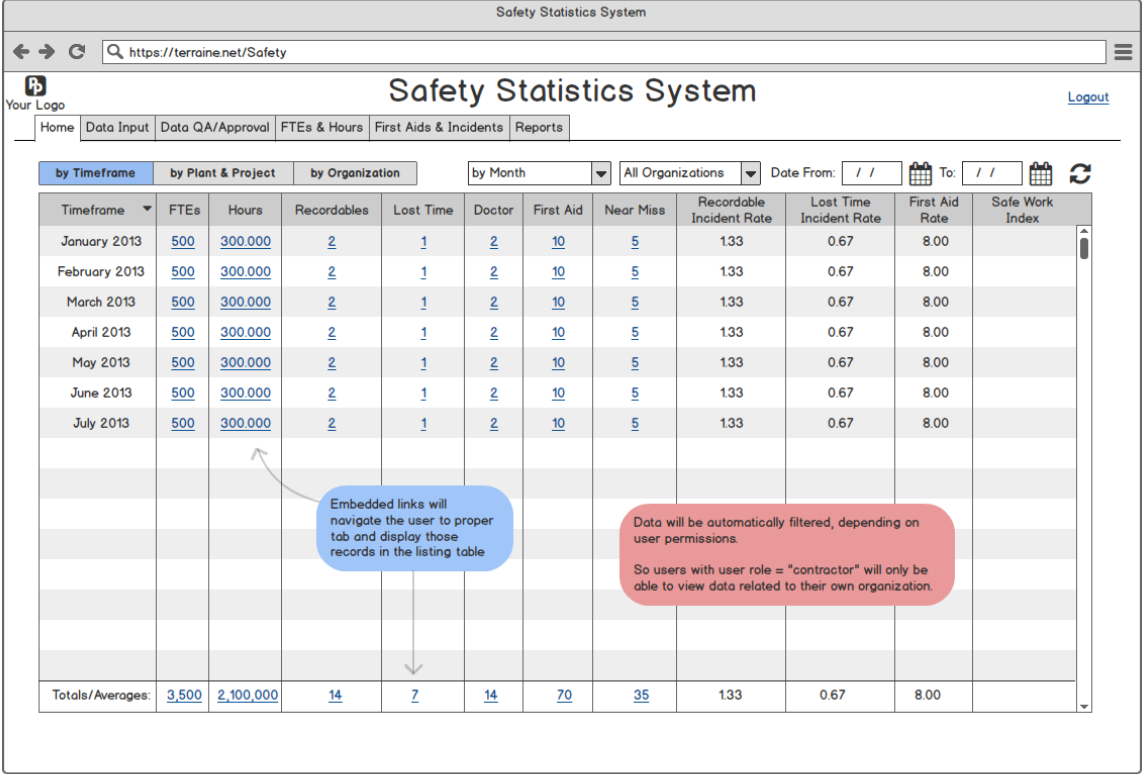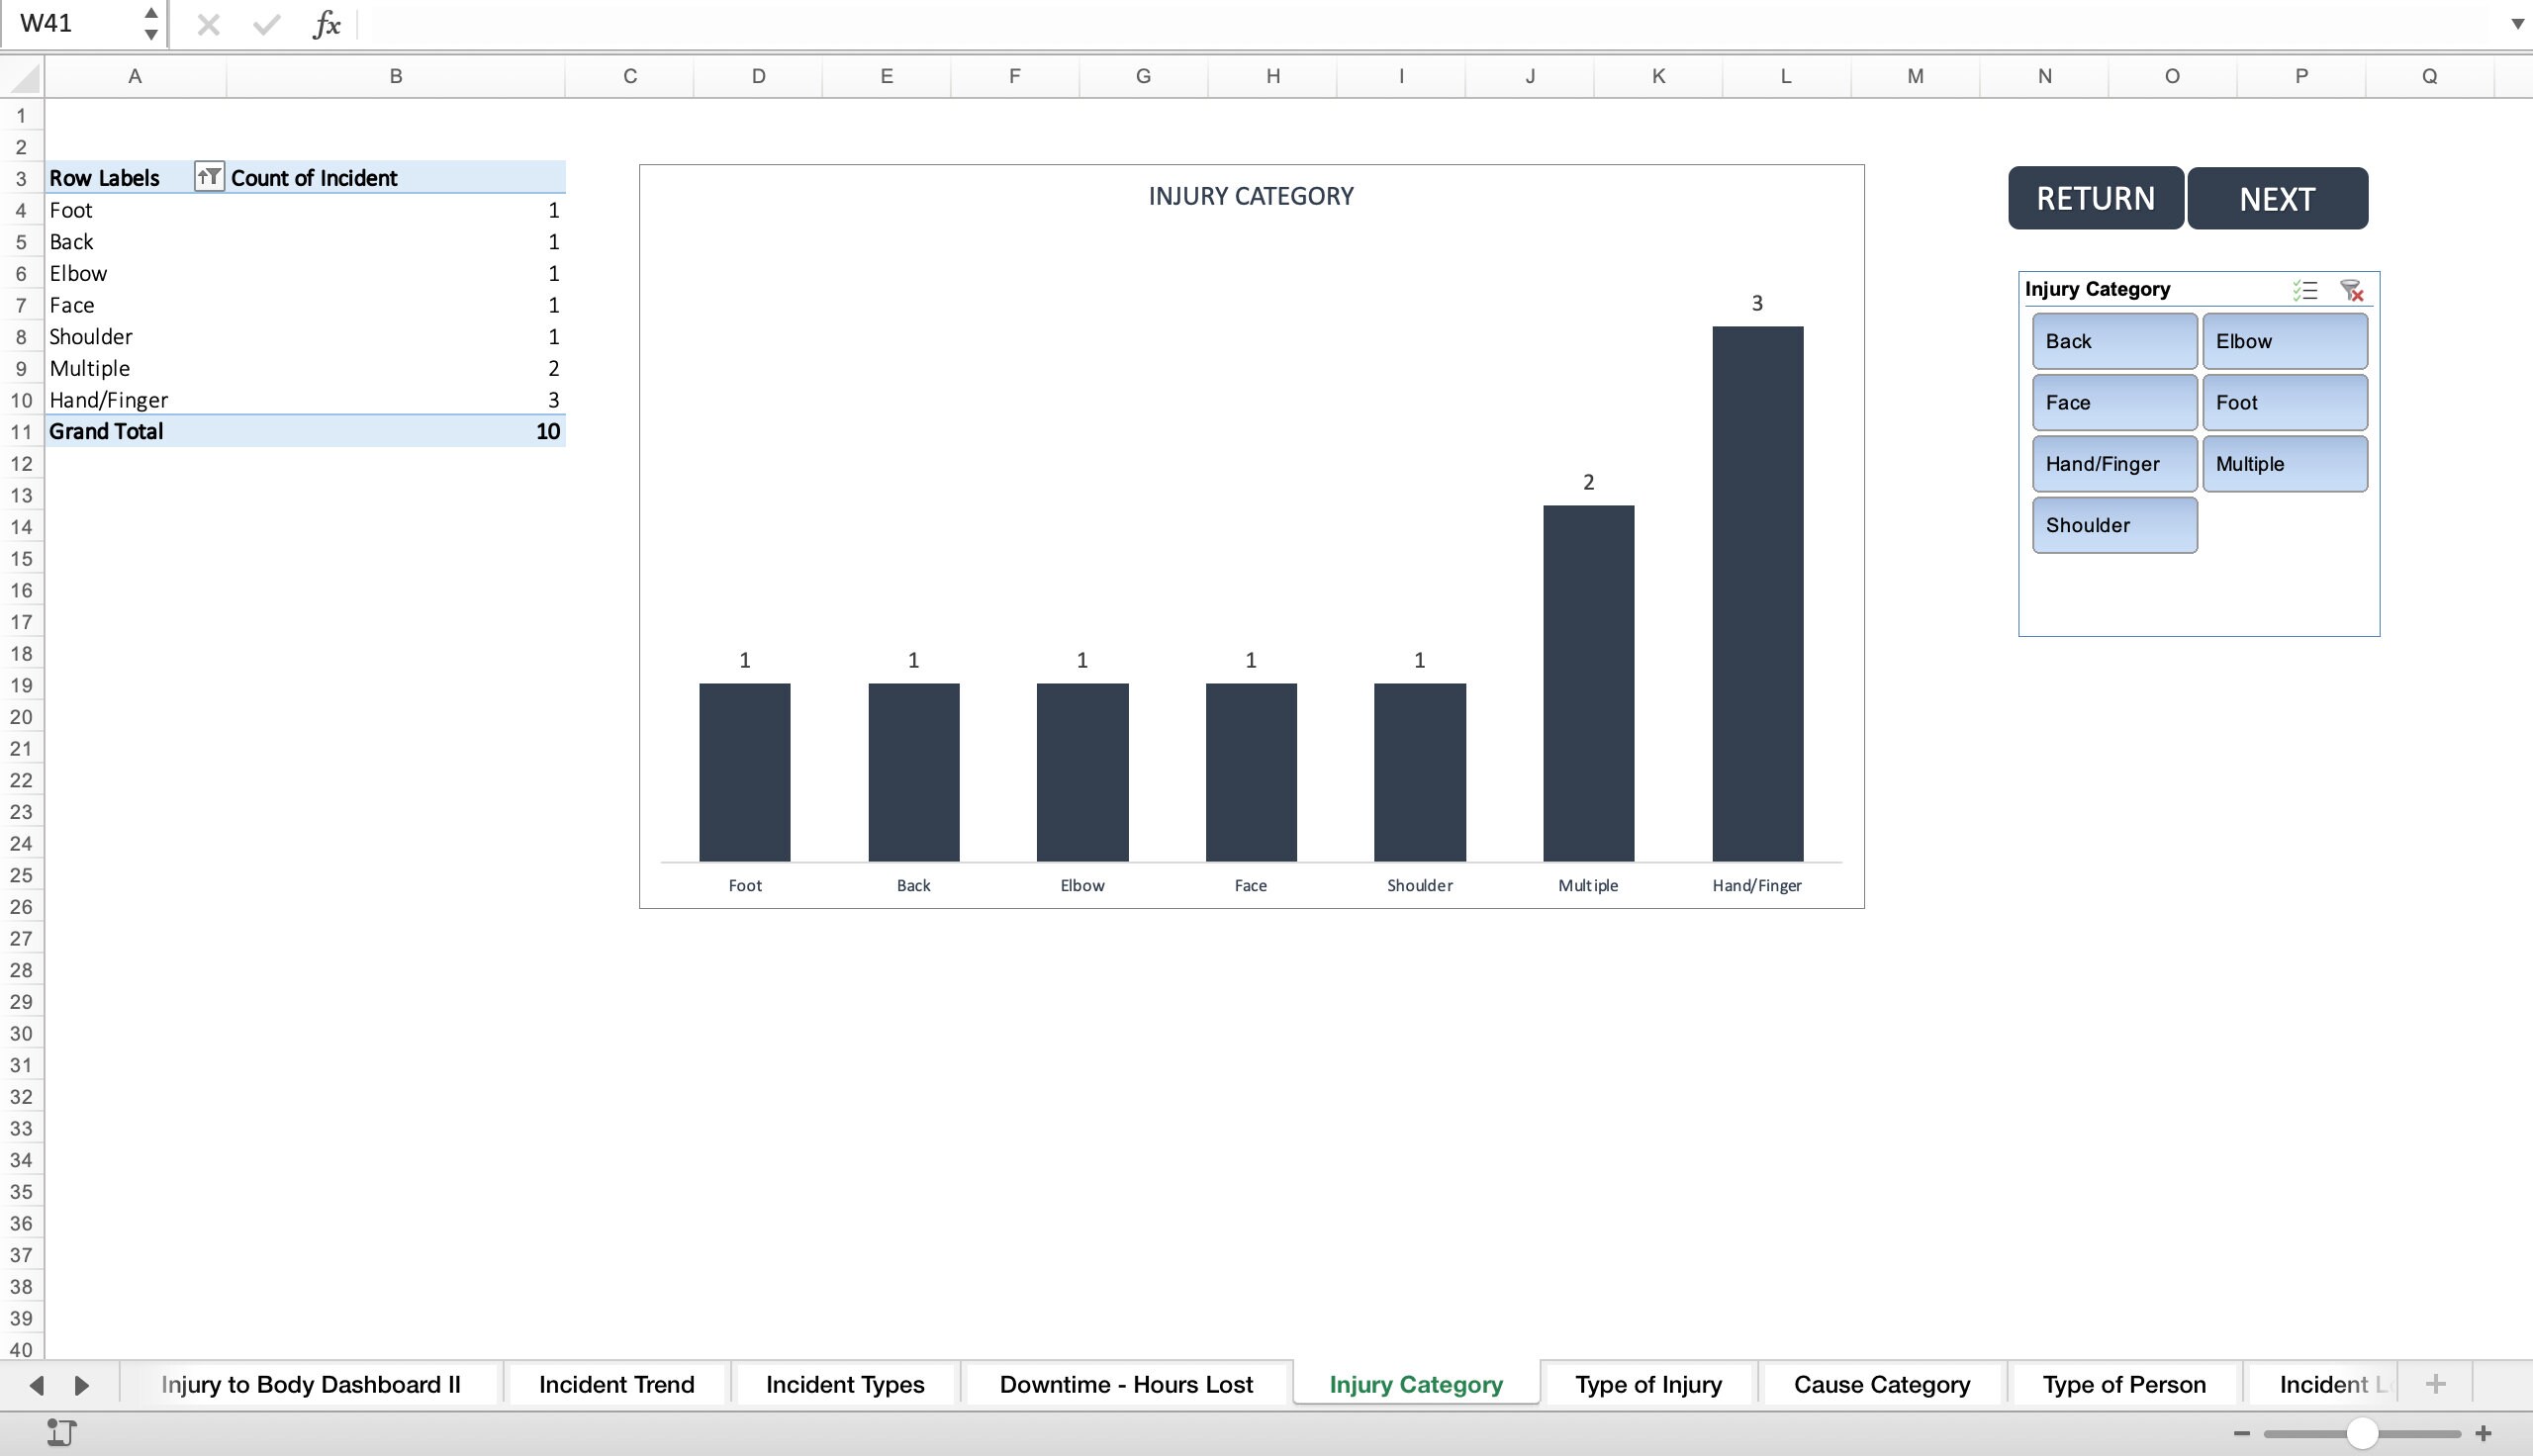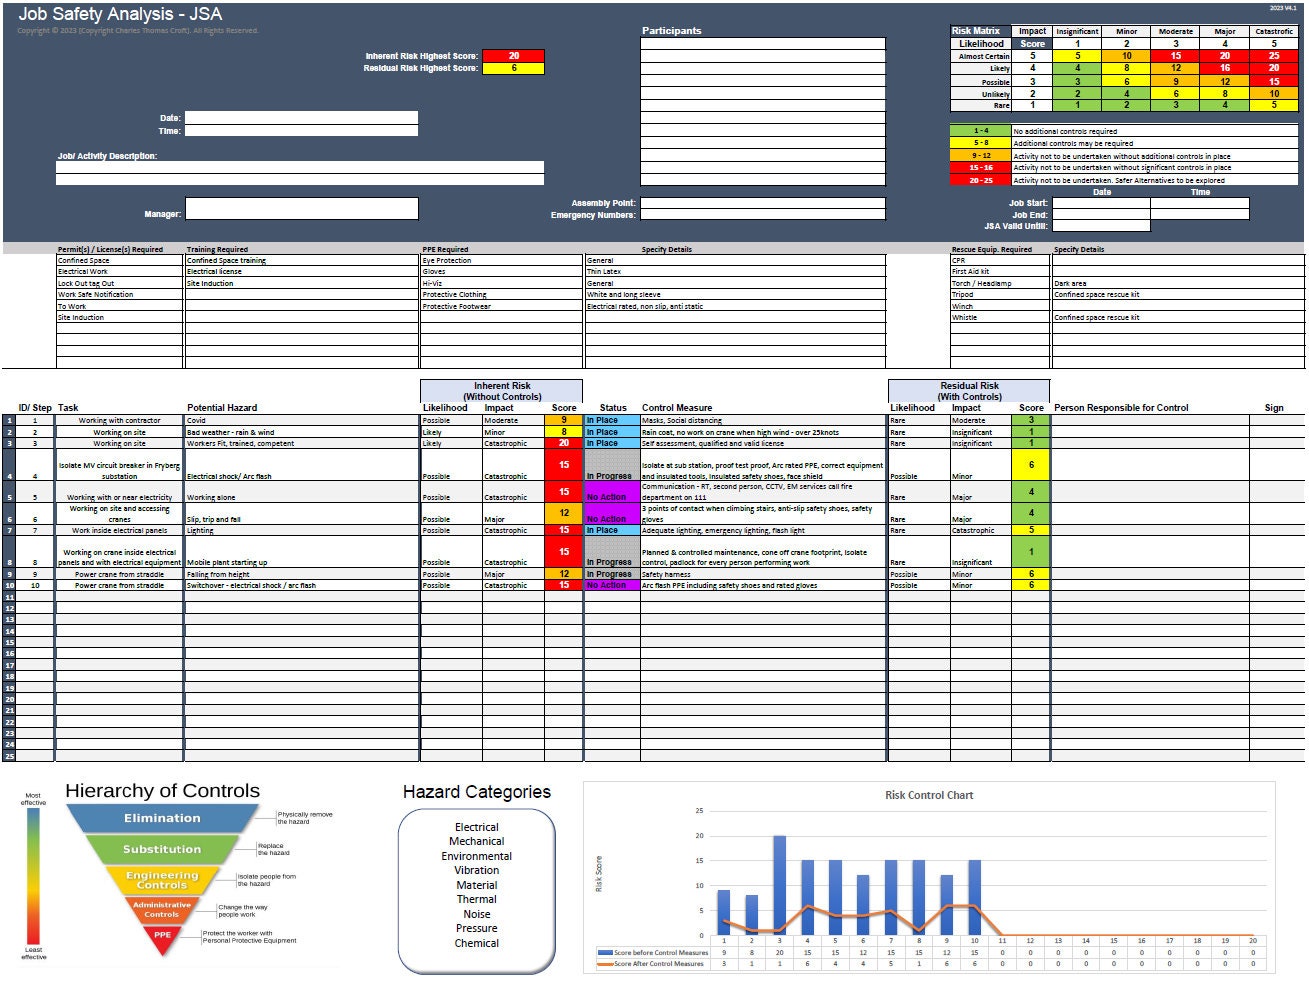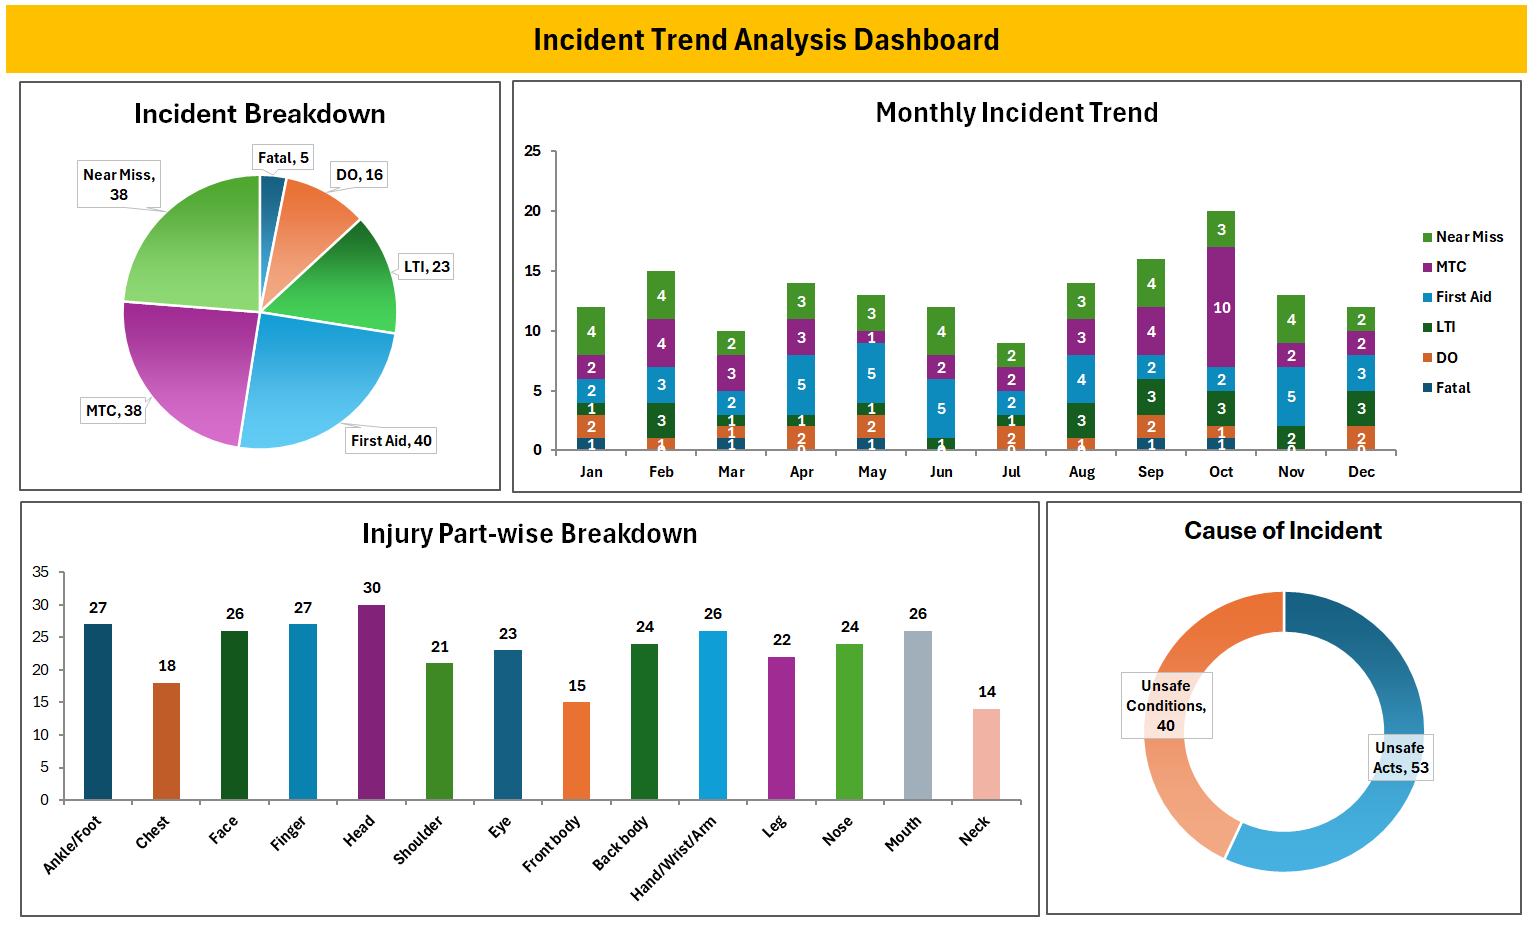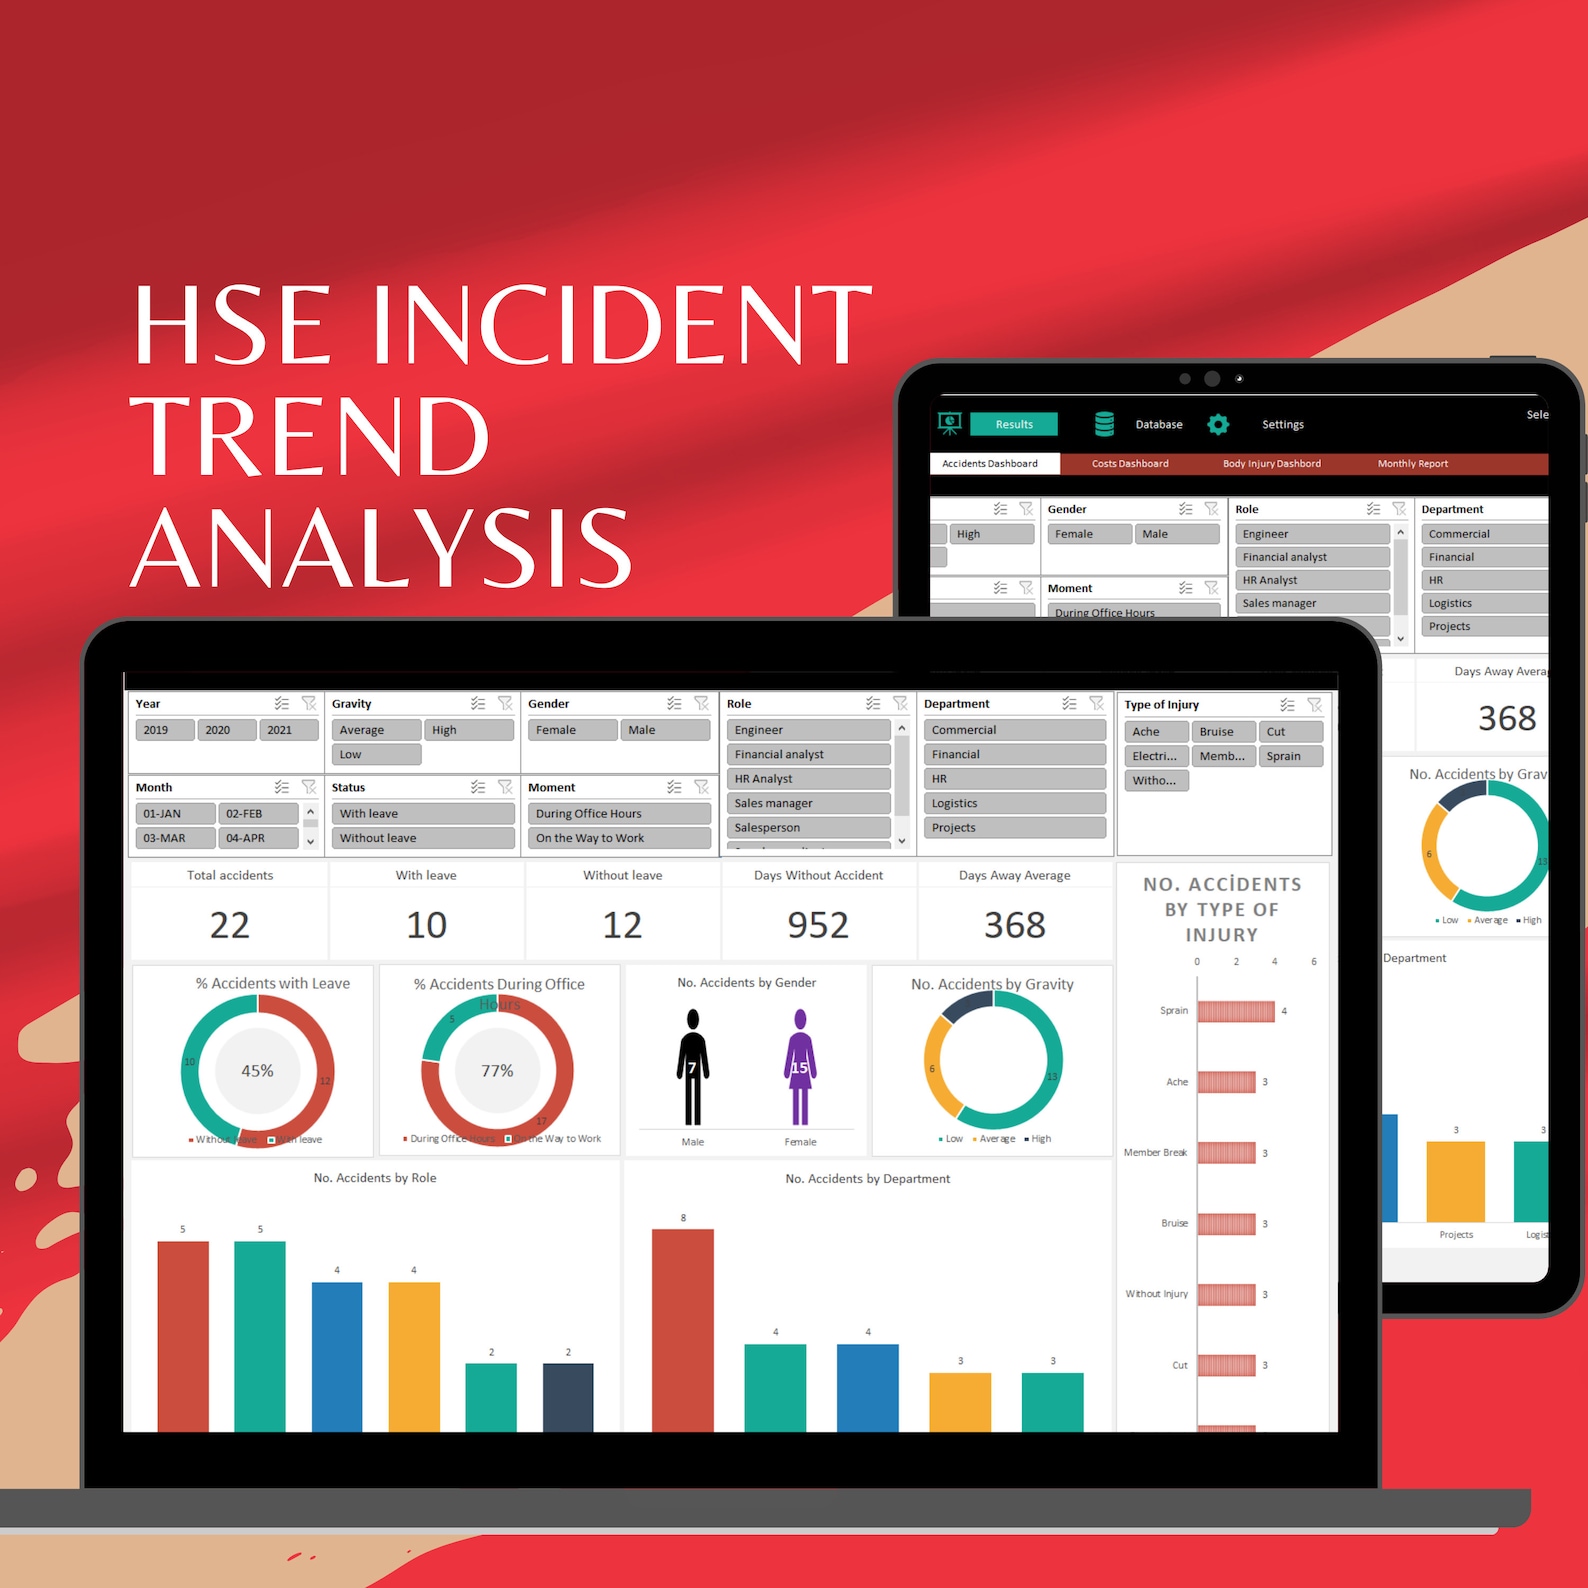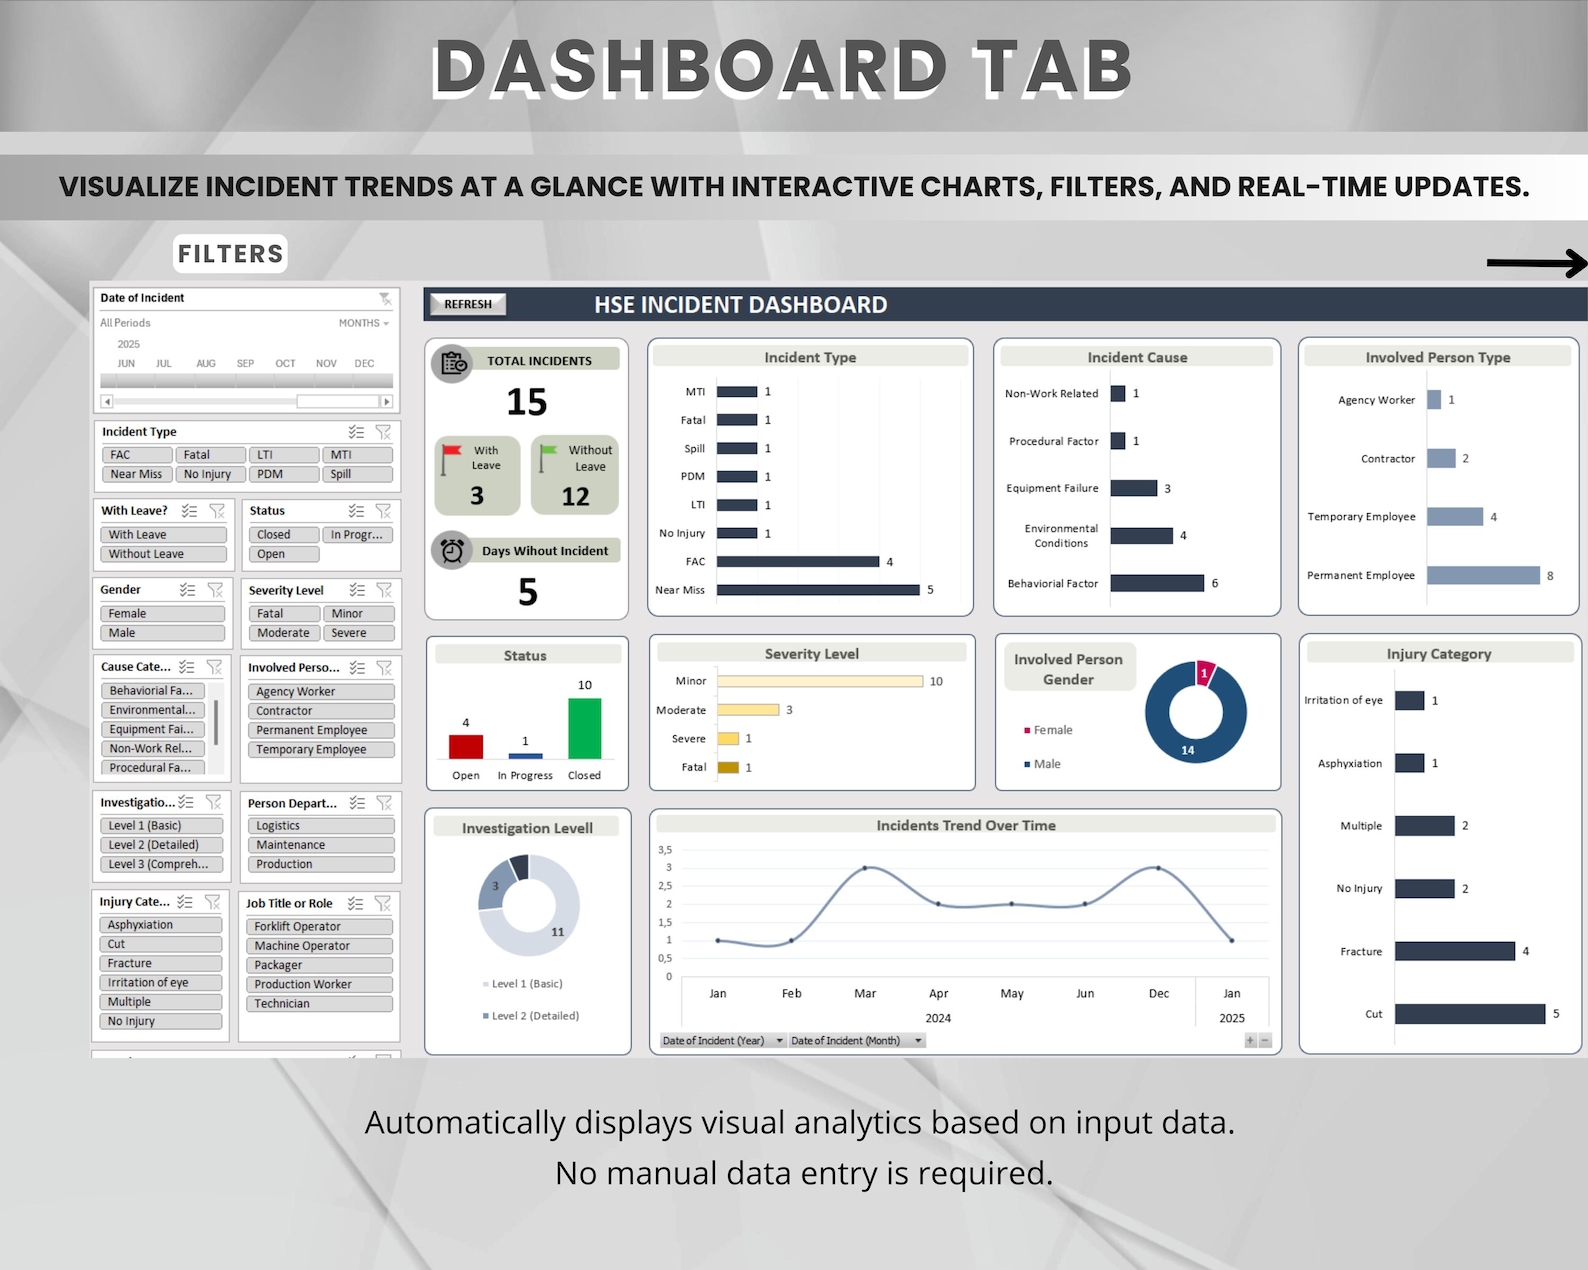
Safety Trend Analysis Excel Template is your gateway to transforming raw incident data into actionable insights that drive safer workplaces. This template is crafted for professionals who demand clarity, precision, and the ability to predict future risks before they become costly accidents. By embedding powerful charting tools, automated calculations, and user-friendly dashboards, it turns spreadsheets from ordinary record‑keeping tools into dynamic decision‑making engines. In this article, we’ll walk through why this template matters, how to set it up, how to interpret the results, and how to customize it for any industry. You’ll leave with a practical playbook that turns safety data into a competitive advantage.
Why a Dedicated Safety Trend Analysis Excel Template Is Essential
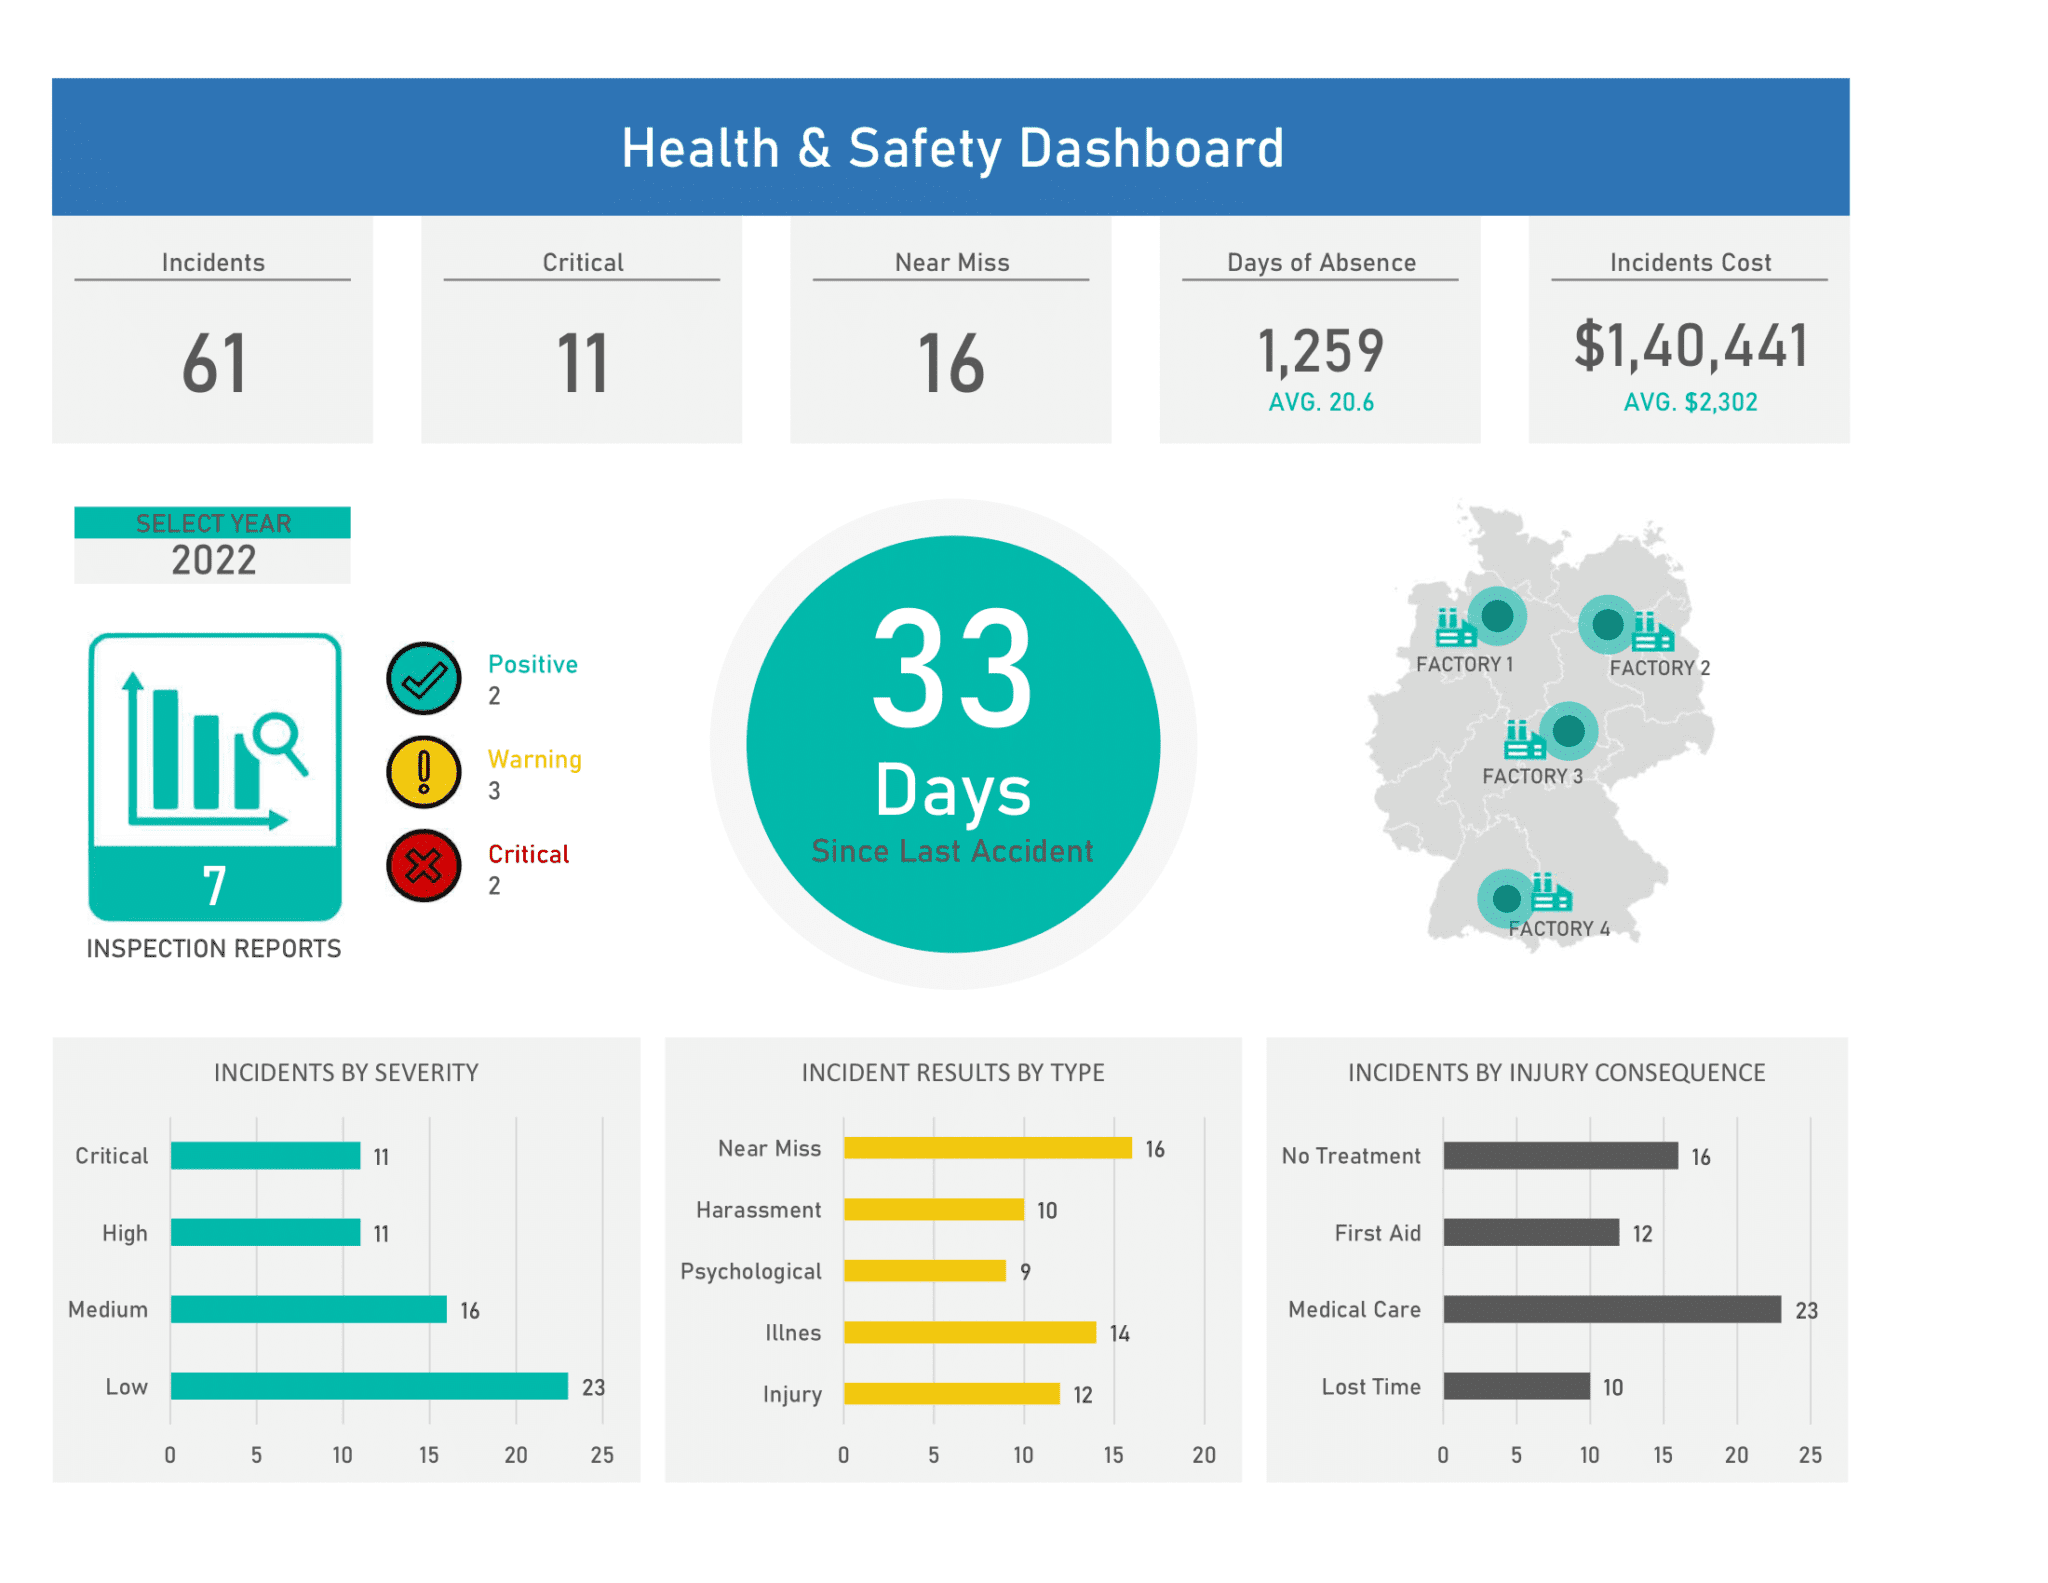
Every organization that collects incident reports ends up with piles of data that sit untouched for months or years. The danger lies not in the data itself but in the lack of systematic analysis that can reveal hidden patterns. A dedicated template centralizes key metrics such as incident frequency, severity scores, root causes, and time‑to‑resolution. With standardized formulas, the template eliminates manual entry errors and ensures that every new incident is instantly scored, categorized, and plotted on trend lines. This level of automation lets safety managers shift focus from data entry to strategic action, ultimately reducing downtime, insurance premiums, and reputational risk.
Key Benefits at a Glance
- Immediate Visibility: Real‑time dashboards show peak risk periods.
- Data Integrity: Built‑in validation rules prevent inconsistent entries.
- Comparability: Standardized metrics enable benchmarking across departments.
- Predictive Insights: Trend lines forecast future incident spikes.
- Scalable: One file can grow from a single plant to an entire corporate network.
Core Features of the Template
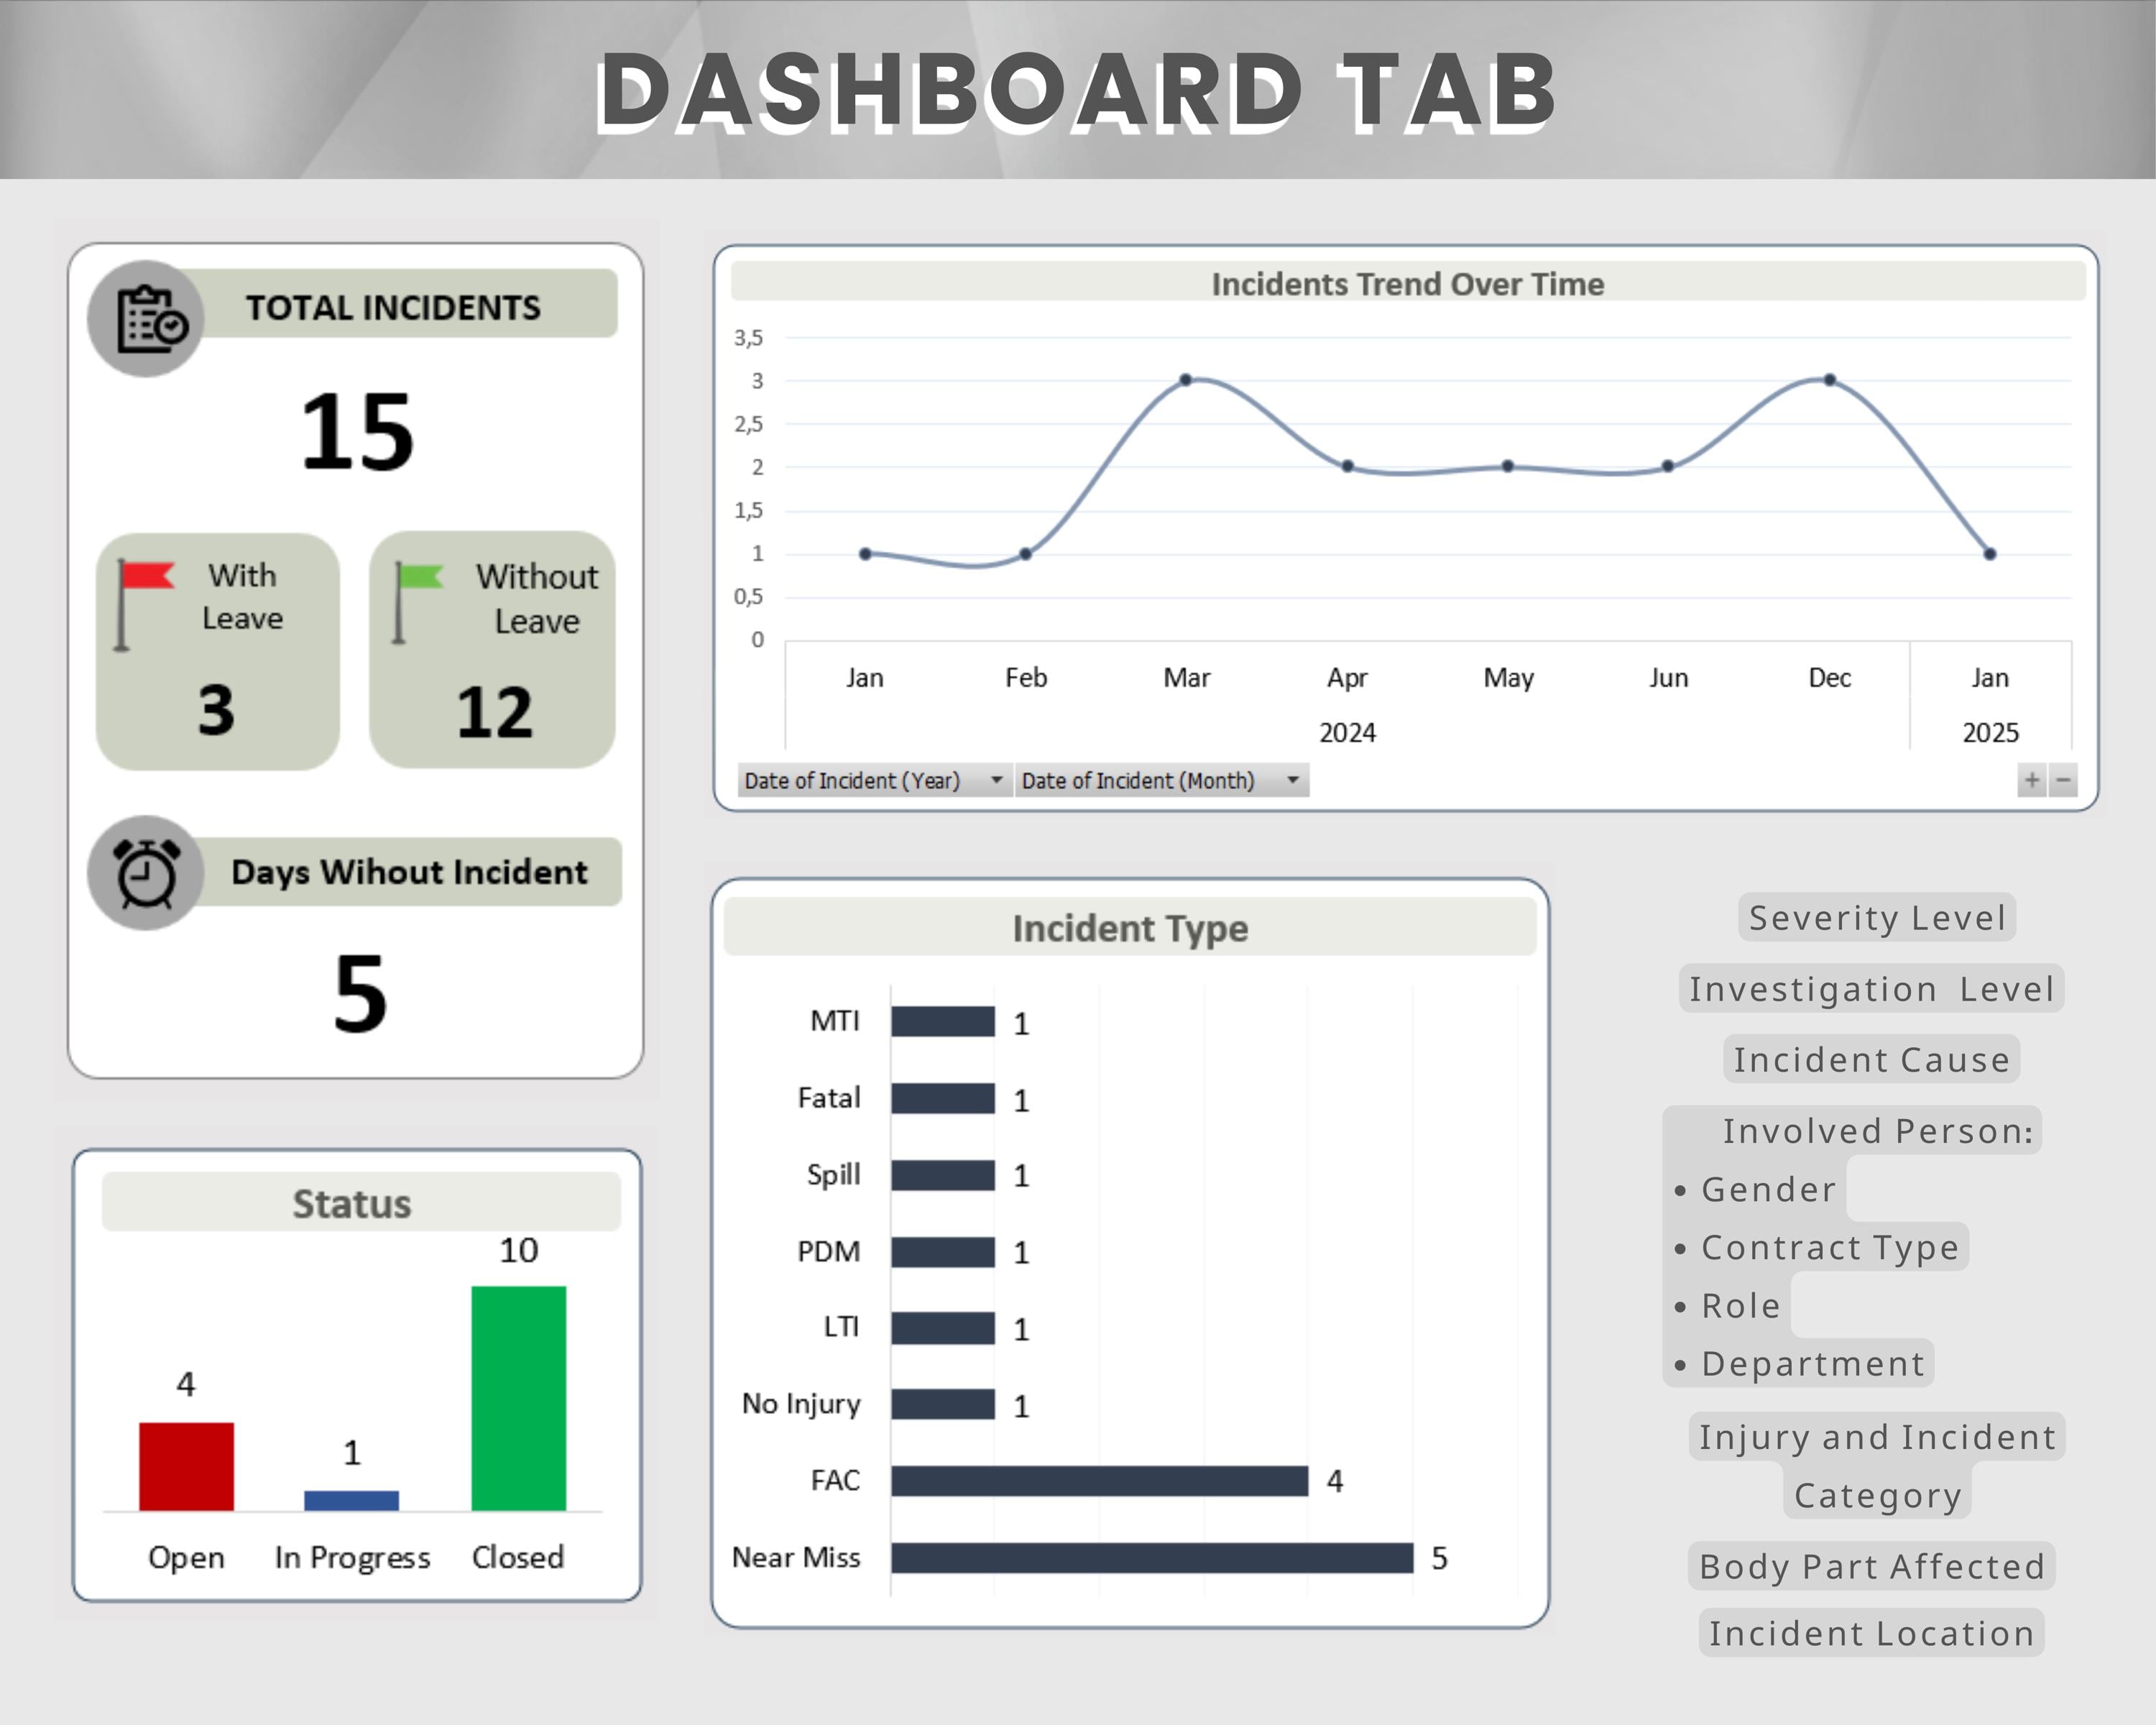
The template’s architecture is modular, allowing you to enable or disable components based on your organization’s maturity level. Below are the essential modules that every safety team should consider:
Incident Register Sheet
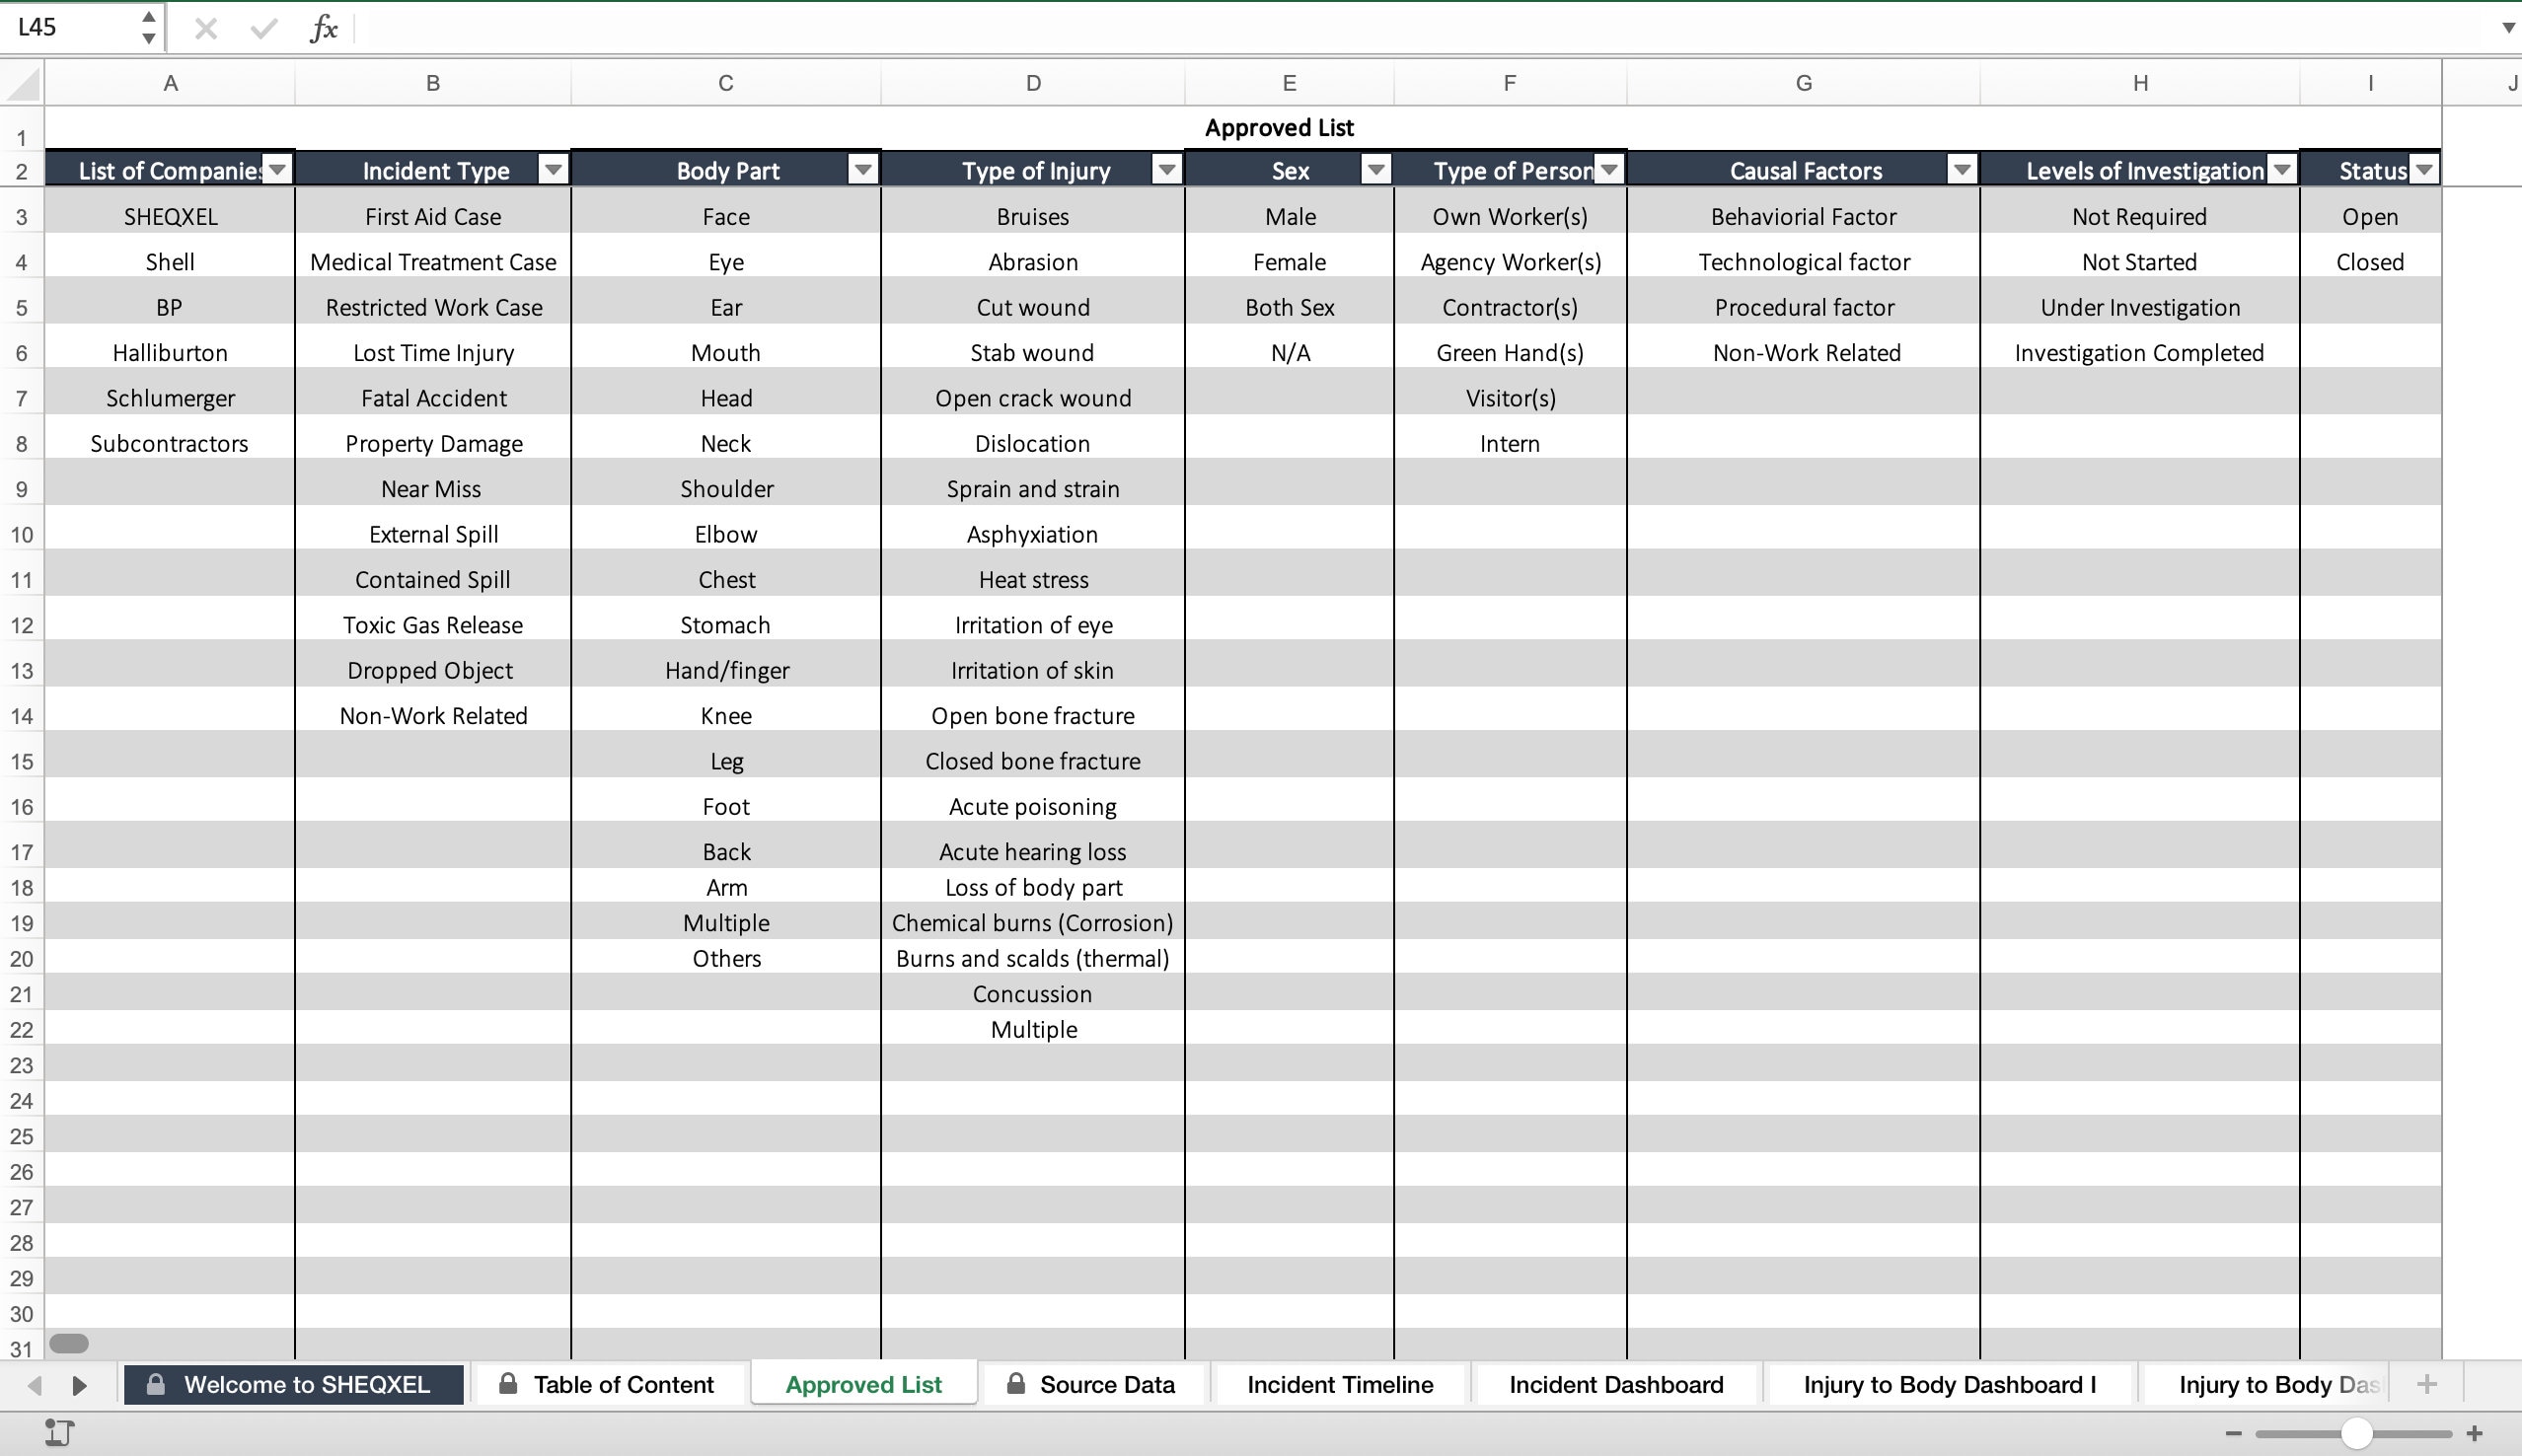
This sheet captures the raw data: date, location, type, severity, and corrective action. Each field is linked to dropdown lists that enforce consistent categorization. The severity column is auto‑calculated using a weighted point system, so you always know the risk impact at a glance.
Trend Analysis Dashboard
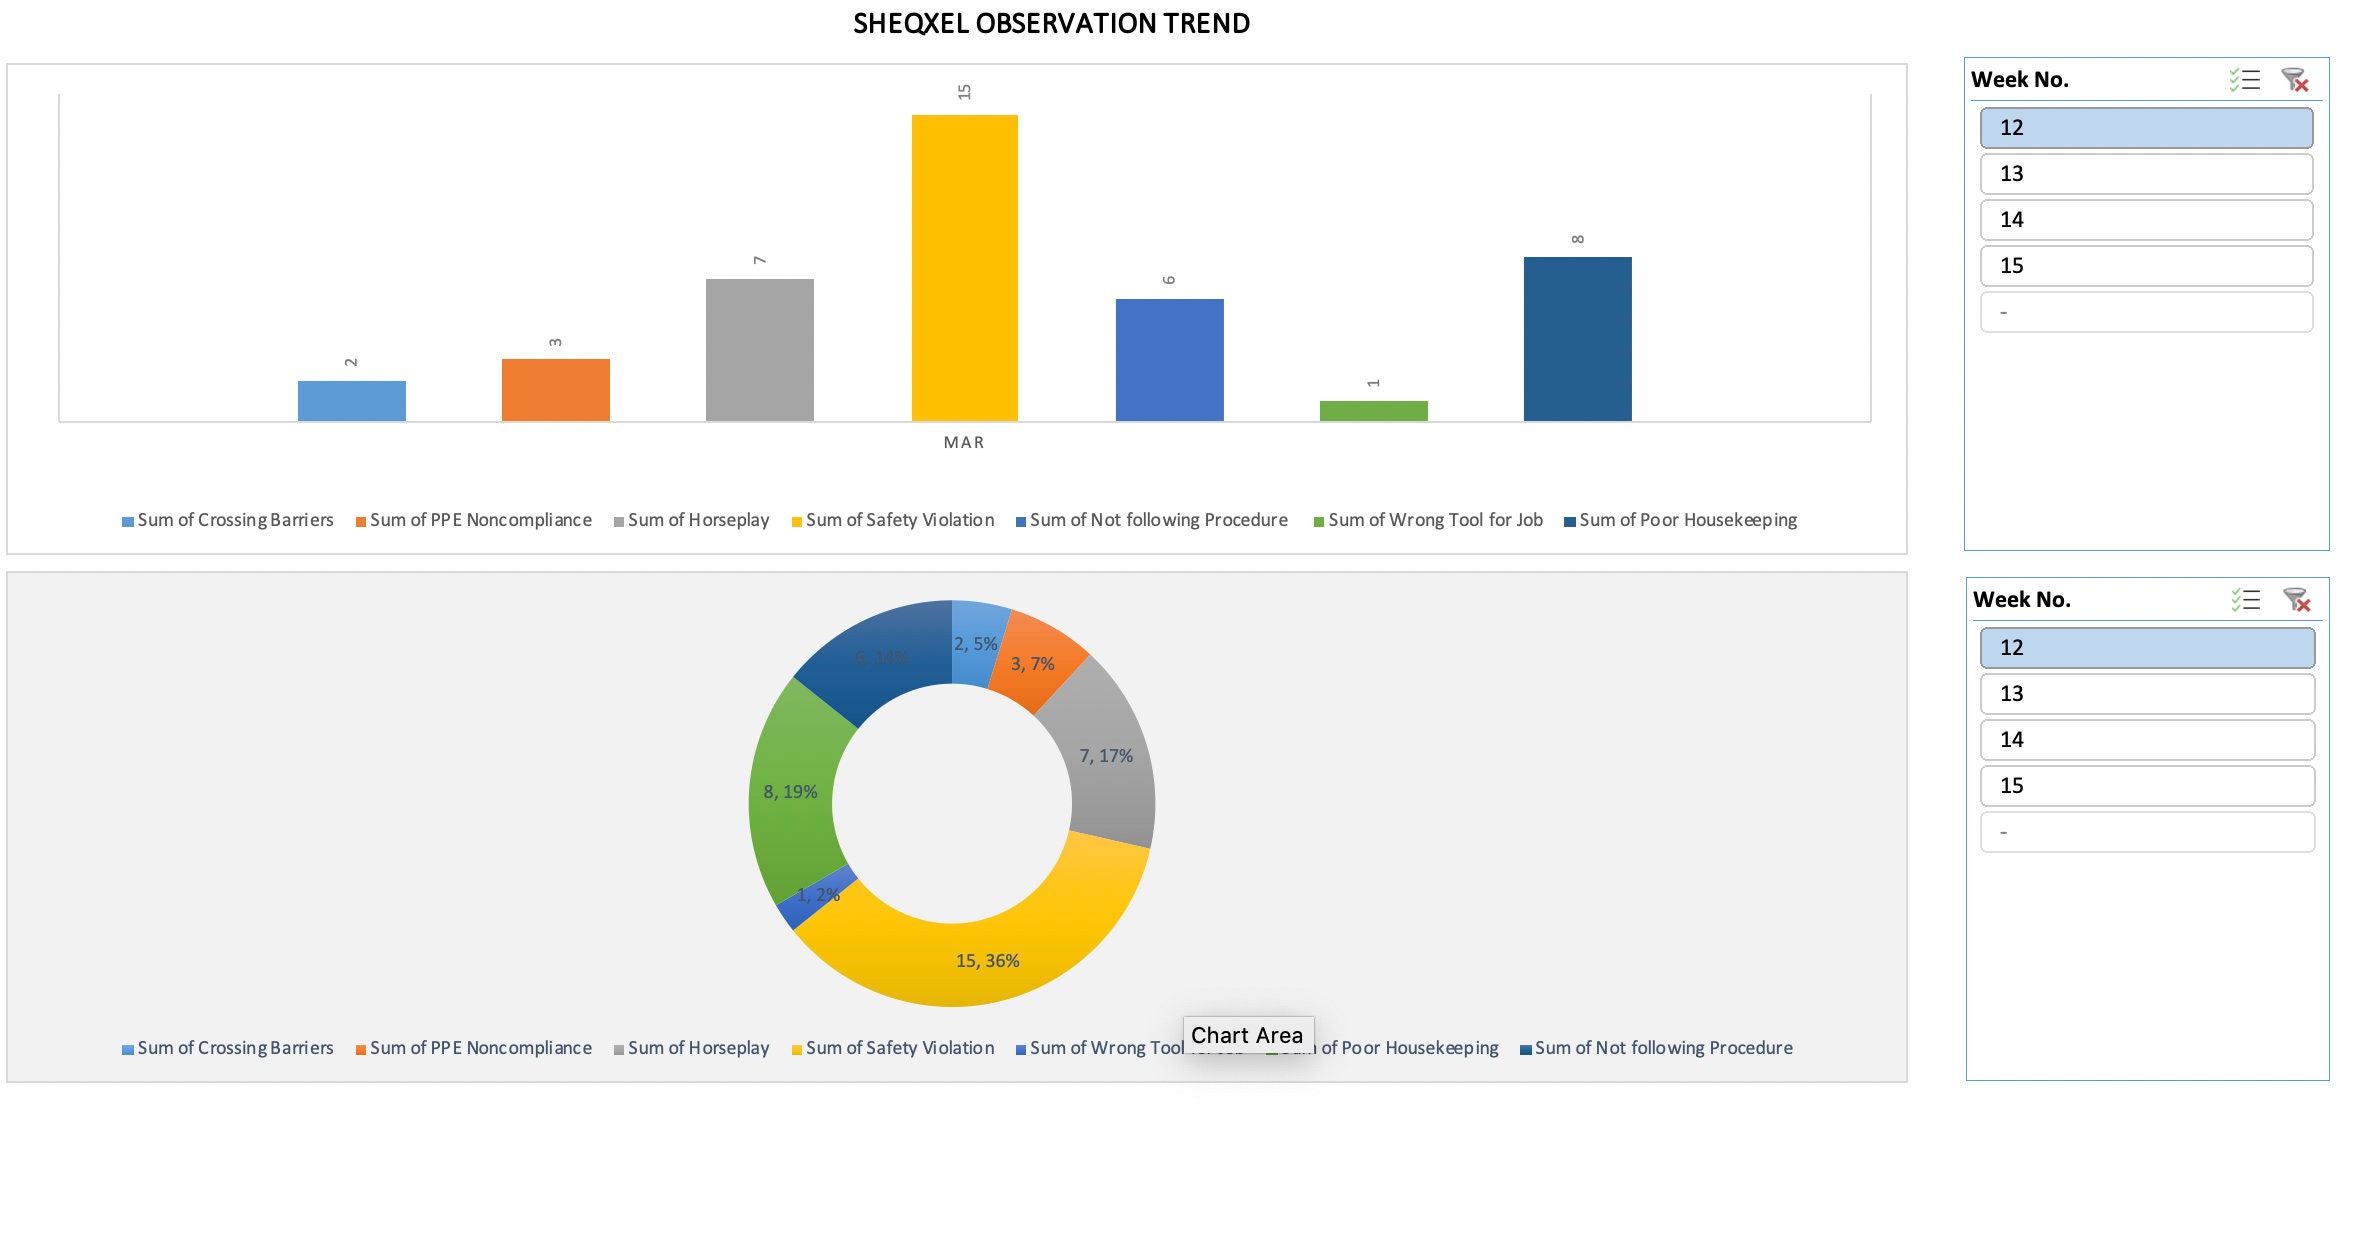
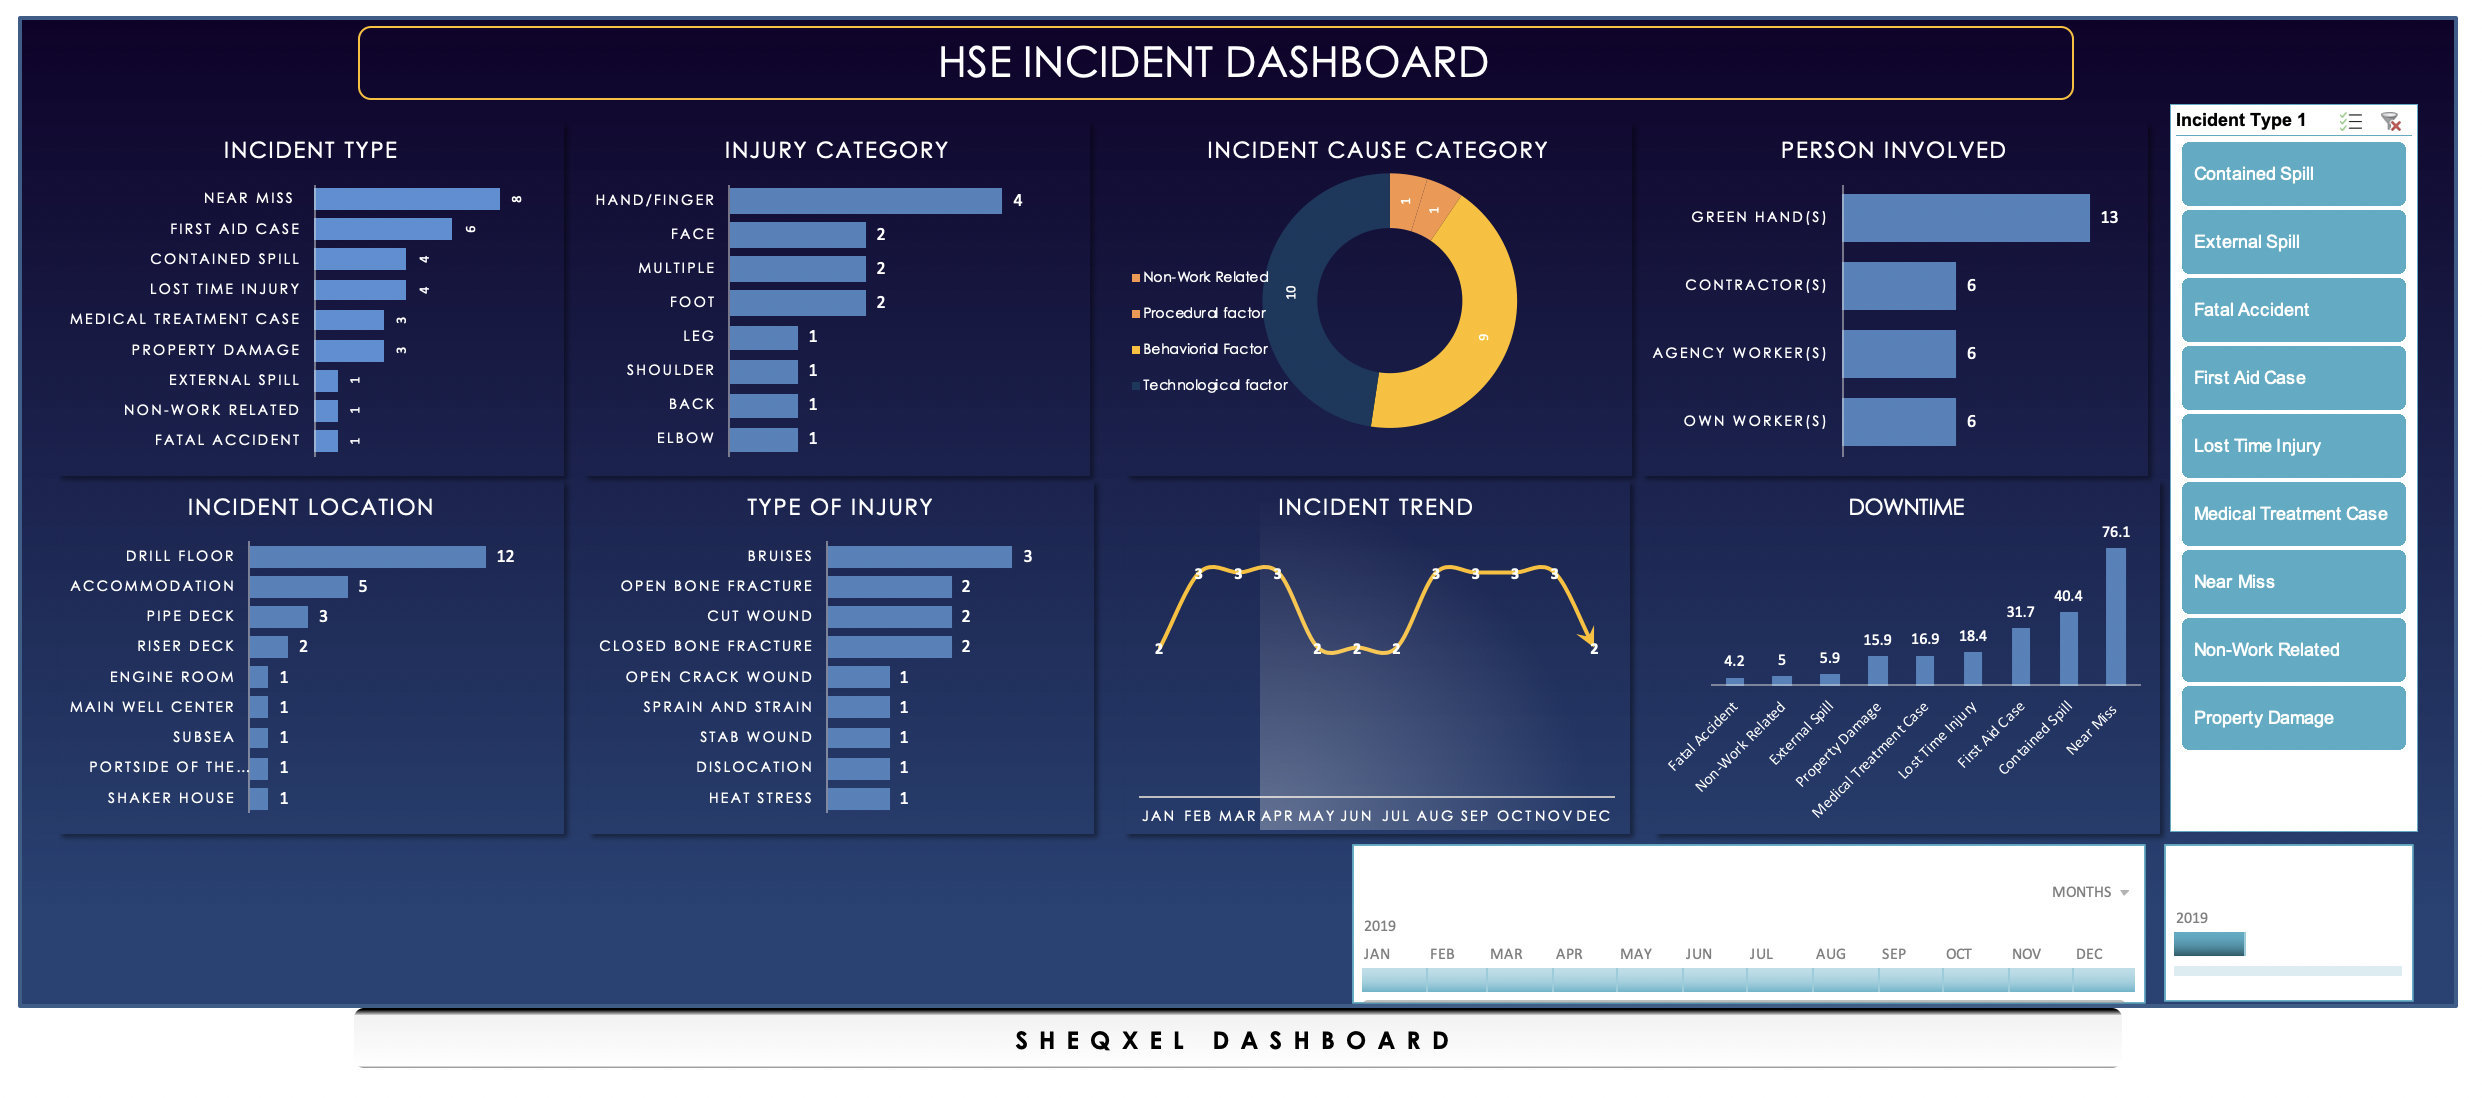
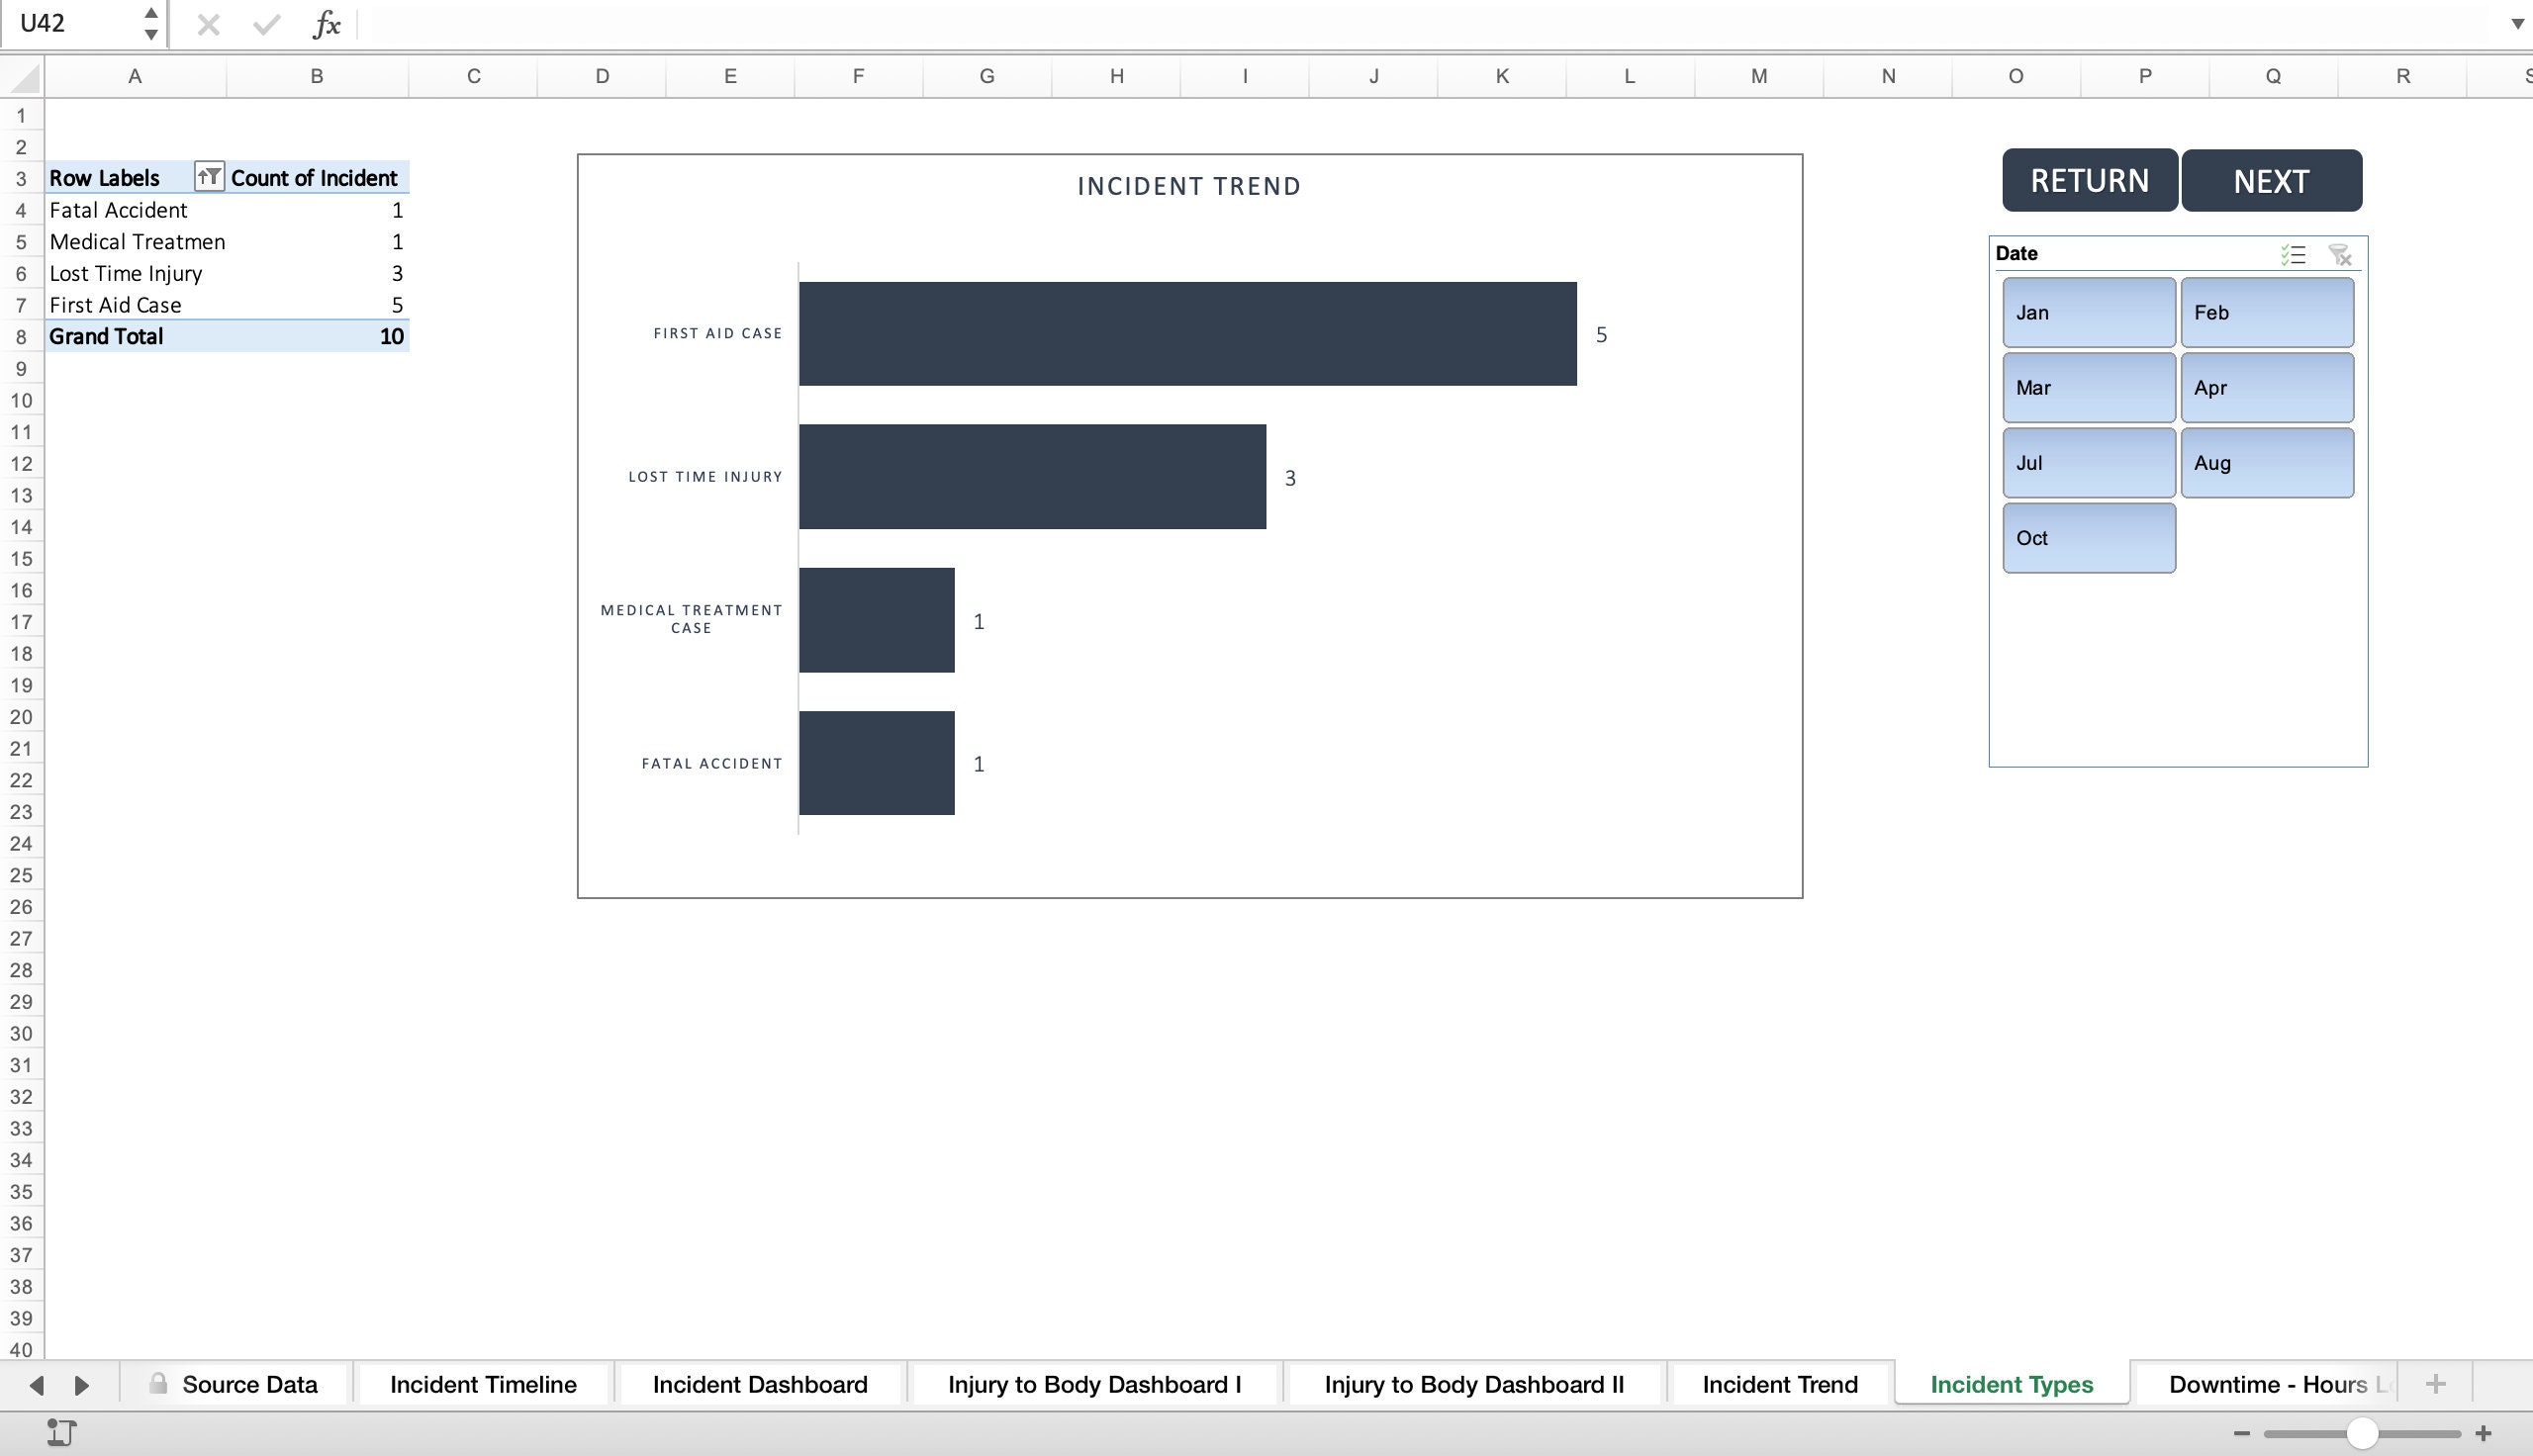
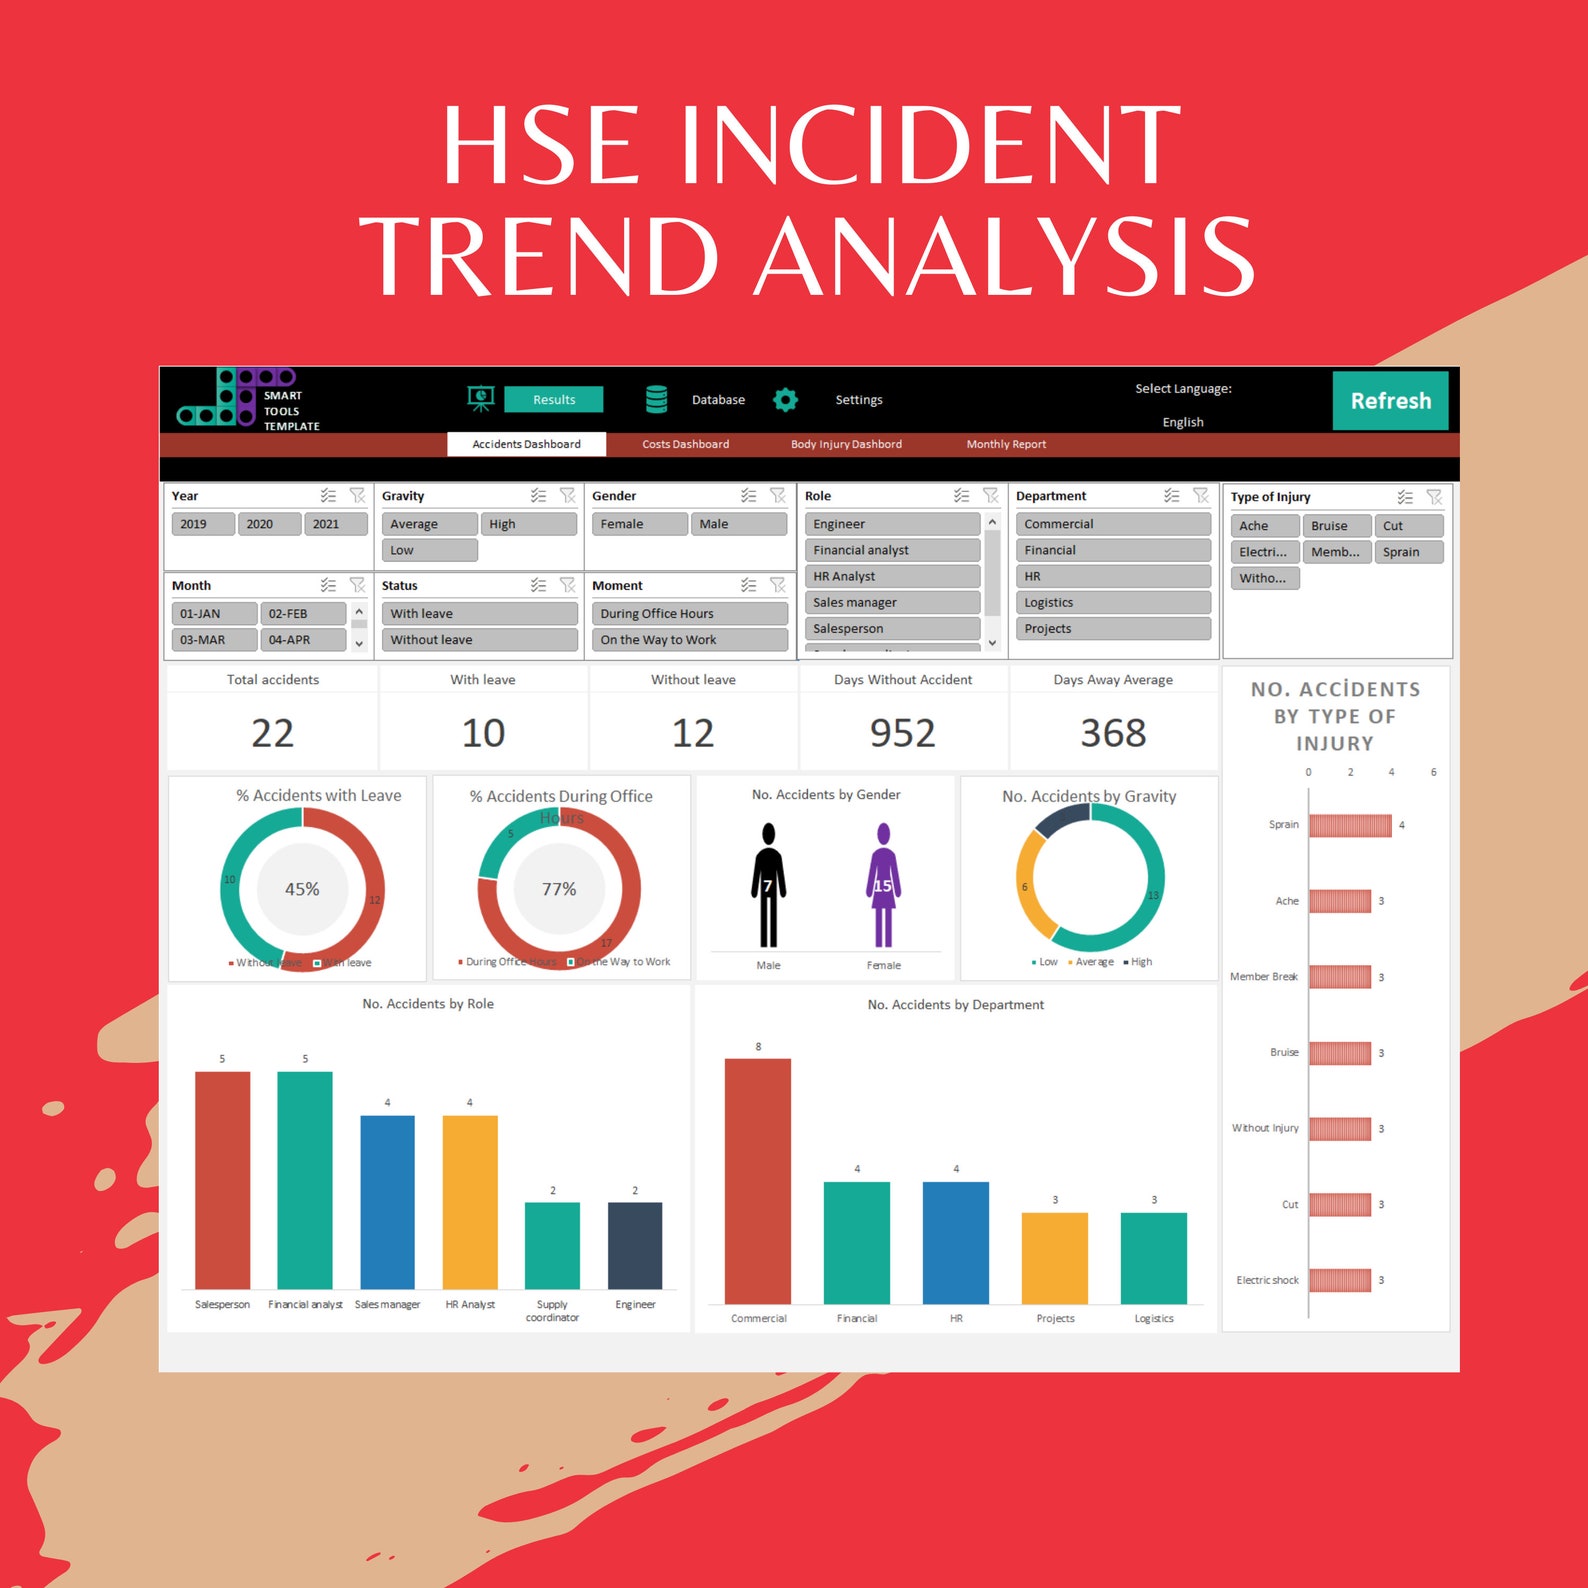
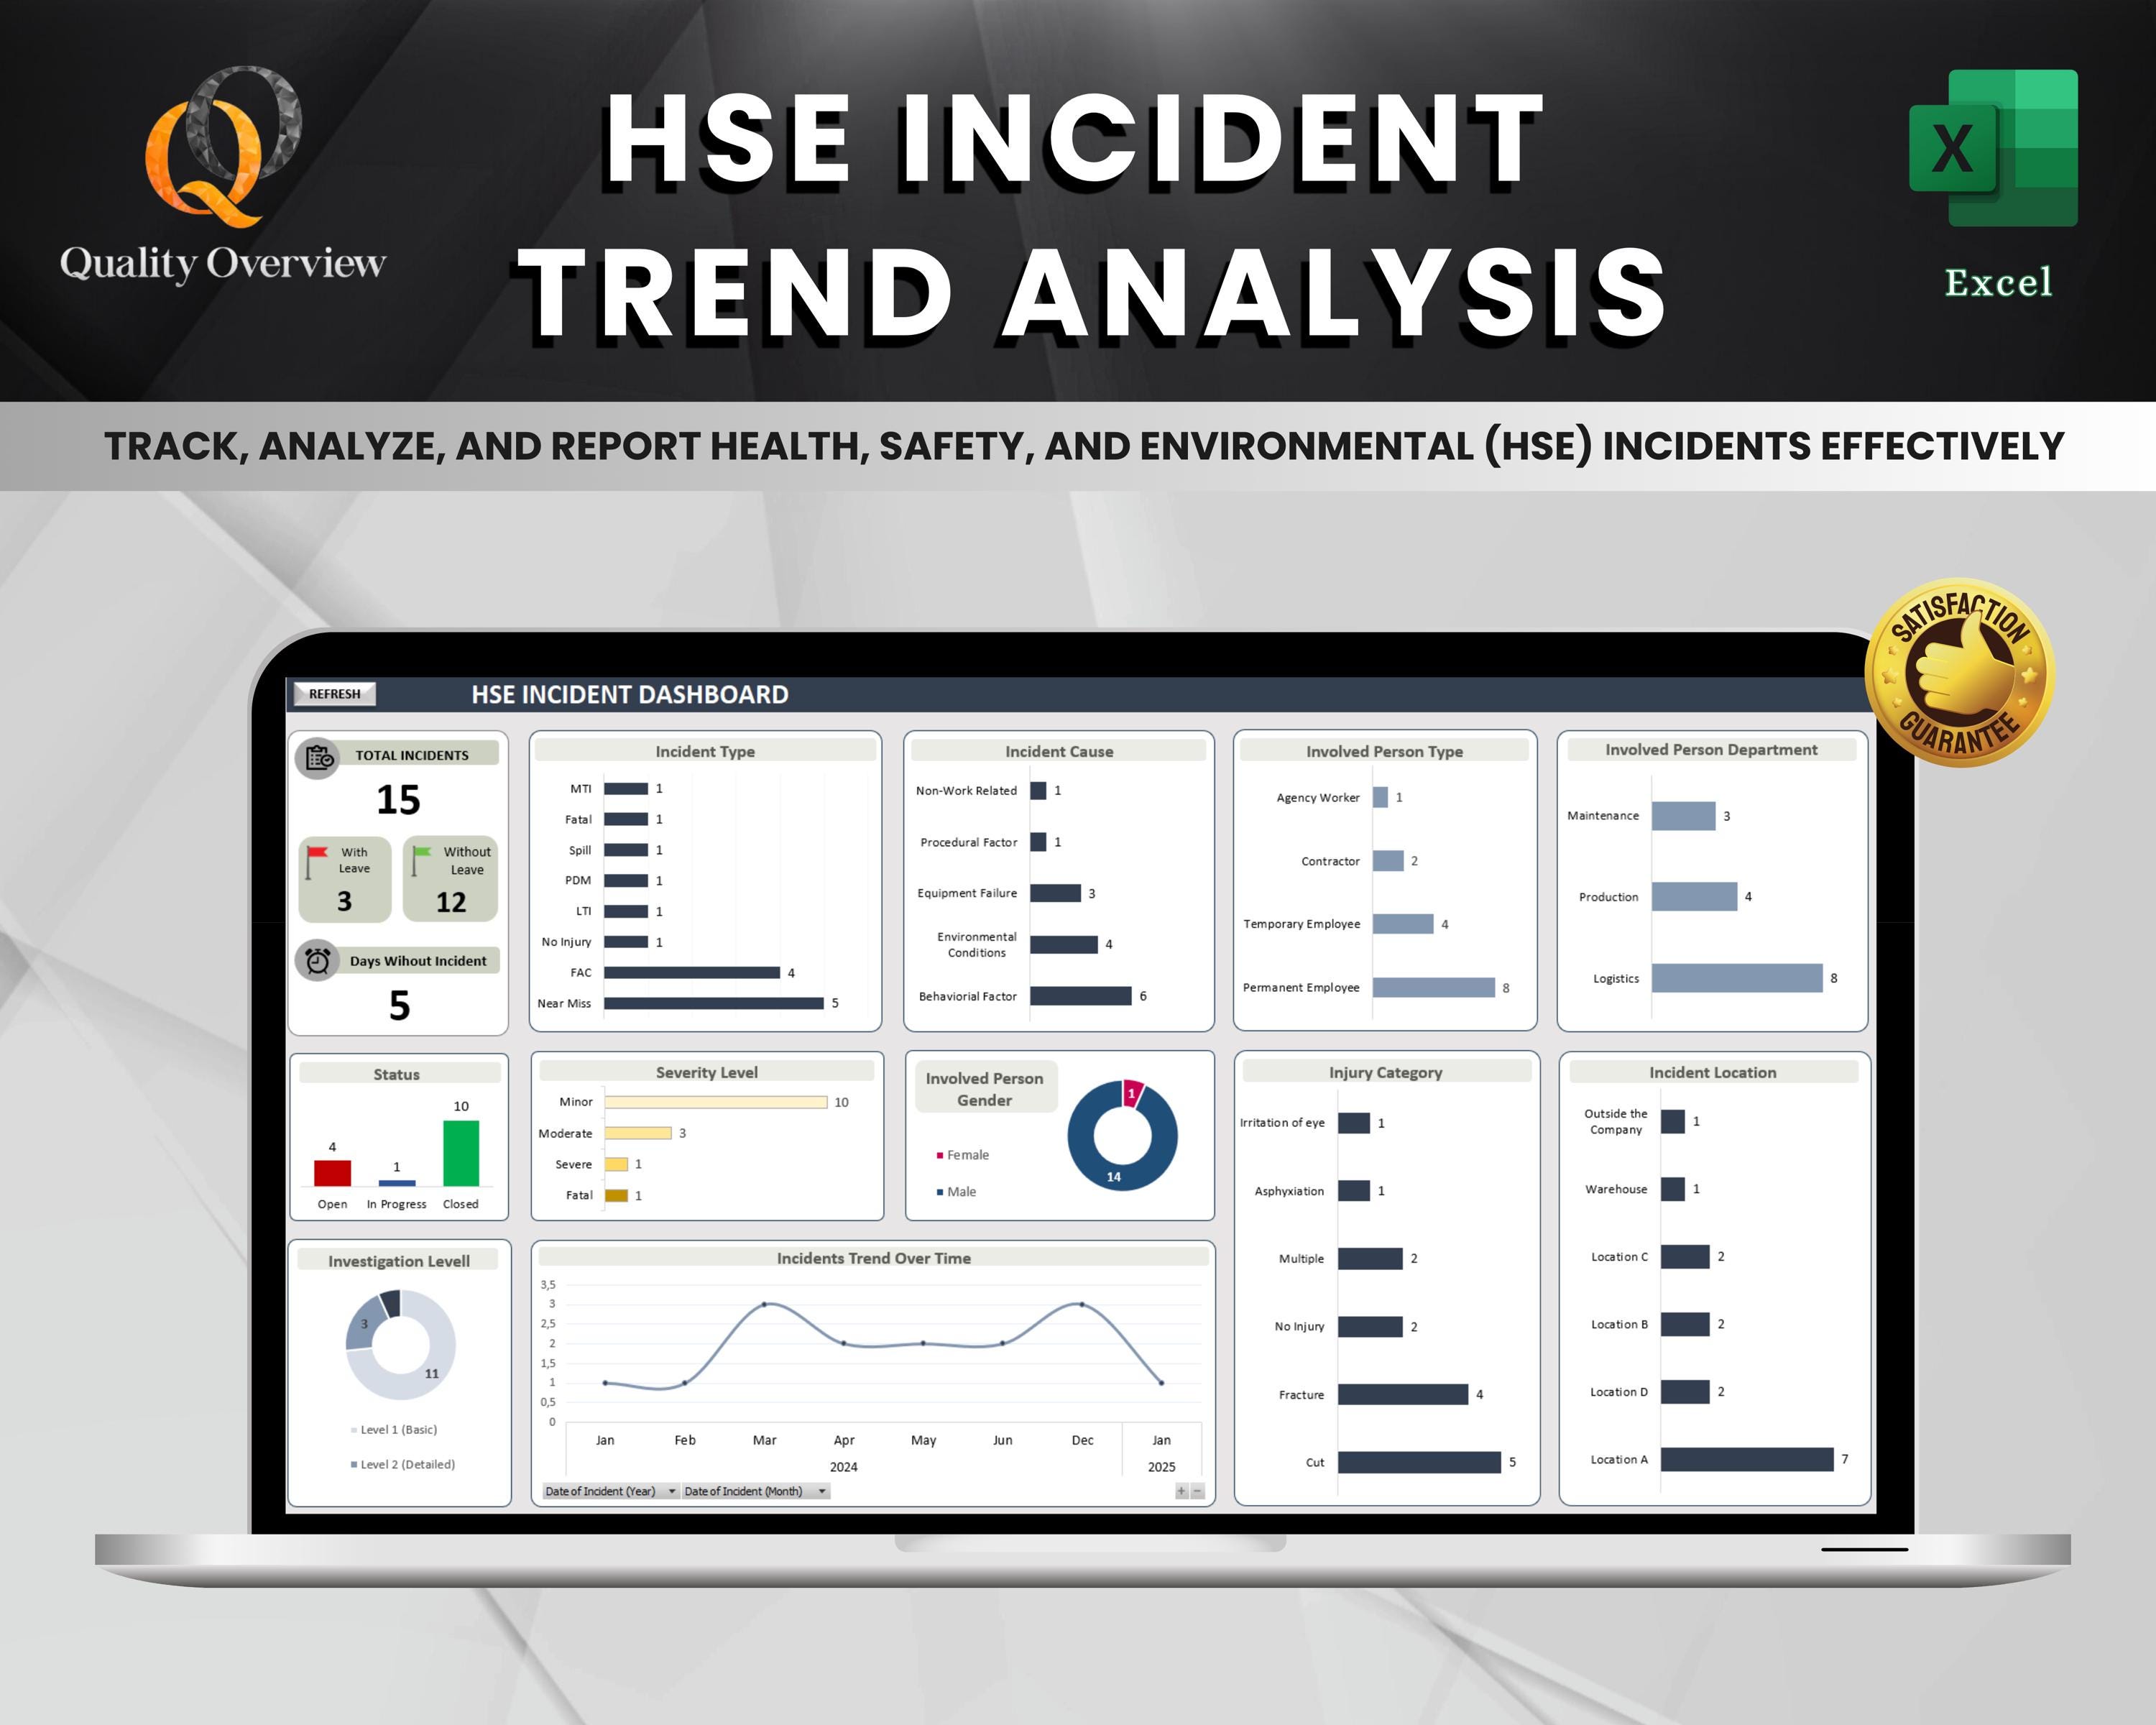
Using dynamic charts and pivot tables, the dashboard visualizes incident frequency over time, severity distribution, and root cause clusters. Interactive slicers let you filter by department, shift, or incident type without altering the underlying data.
Root Cause Heatmap
Heatmaps highlight the most frequent root causes per department. By coloring cells from green (low occurrence) to red (high occurrence), managers can instantly spot systemic issues that require corrective measures.
Predictive Forecast Table
Employing a simple exponential smoothing algorithm, the template projects incident trends for the next 12 months. These forecasts can be used to set preventive maintenance schedules or allocate safety budgets proactively.
Audit Trail Log
Every edit is timestamped and logged, ensuring accountability and compliance with regulatory requirements. The log is hidden from daily view but can be exported for audit purposes.
Step‑by‑Step Guide to Using the Template
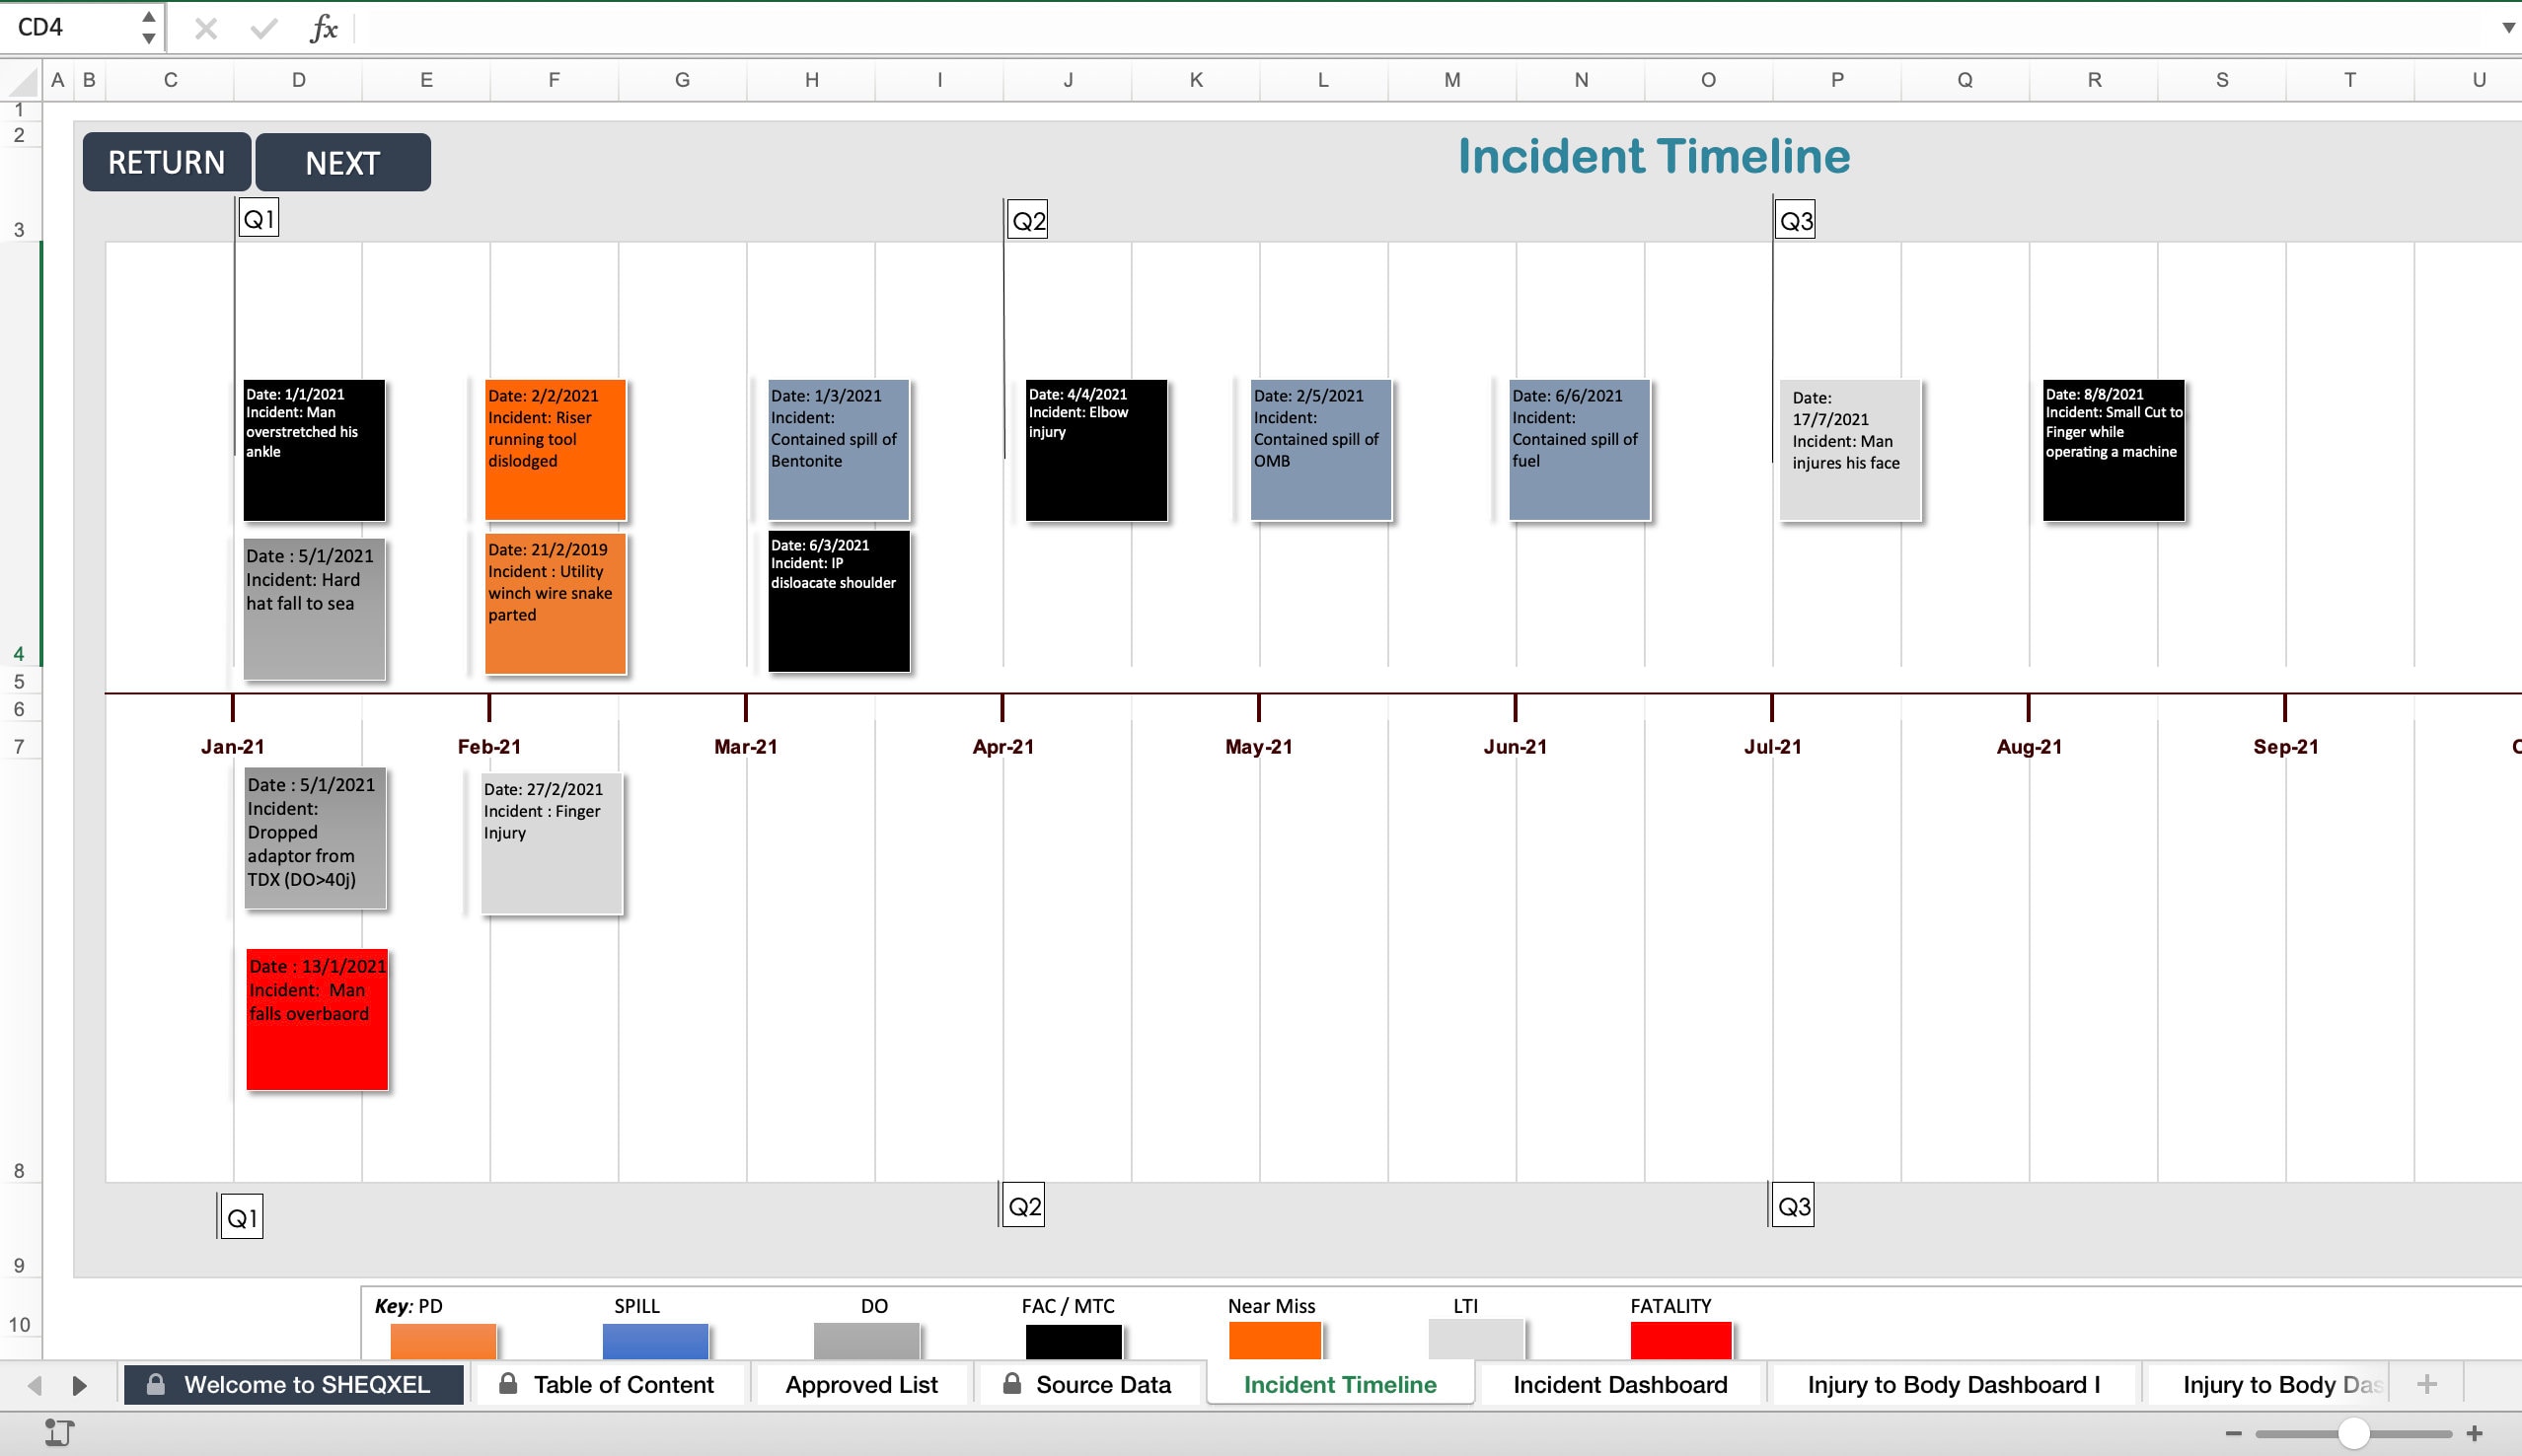
Mastering the template involves a few deliberate steps. Follow this guide to ensure you extract maximum value from every data entry.
1. Initial Setup
Download the template and save it to a secure shared location. Set the workbook password if your organization requires data protection. Open the Settings tab and configure company‑specific parameters such as shift patterns, incident severity thresholds, and custom dropdown lists.
2. Entering Incident Data
Navigate to the Incident Register sheet. Fill in the incident date, location, category, and description. The severity field will populate automatically based on the severity criteria you set. Always double‑check the root cause selection; it will drive the heatmap and trend calculations.
3. Reviewing the Dashboard
Switch to the Dashboard sheet. The line chart will update instantly with each new entry. Use the slicers at the top right to focus on a specific department or time period. Pay special attention to any abrupt spikes in the trend line; investigate the underlying incidents immediately.
4. Analyzing Root Causes
Open the Root Cause Heatmap. The color intensity reveals the most prevalent issues. If a particular root cause dominates, consider conducting a focused root‑cause analysis session and implementing corrective actions.
5. Interpreting Forecasts
In the Forecast Table, review the projected incident counts for the upcoming quarter. Compare these figures to your current safety targets. If forecasts exceed acceptable limits, schedule additional training or safety inspections.
6. Maintaining Data Quality
Run the Data Validation Check monthly to identify missing entries or inconsistent categorizations. Use the Audit Log to trace any erroneous changes and correct them promptly.
Customizing the Template for Your Industry

While the default template covers many use cases, tailoring it to your specific sector amplifies its effectiveness. Below are industry‑specific adjustments you can make:
Construction
Add a “Permit Expiry” field to track high‑risk work permits. Incorporate a “Hard Hat” compliance checkbox. Use a separate color scheme for fall‑related incidents.
Manufacturing
Include an “Equipment ID” column and link it to a maintenance log. Introduce a “Machine Shutdown” trigger that automatically flags incidents involving critical machinery.
Healthcare
Track “Patient Fall” incidents separately. Add a “Medication Error” field and use a red‑alert system for any adverse drug events. Ensure HIPAA compliance by encrypting patient identifiers.
Retail
Implement a “Customer Incident” flag and track foot traffic data. Add a “Security Response Time” metric to evaluate incident resolution speed.
Interpreting the Trend Data
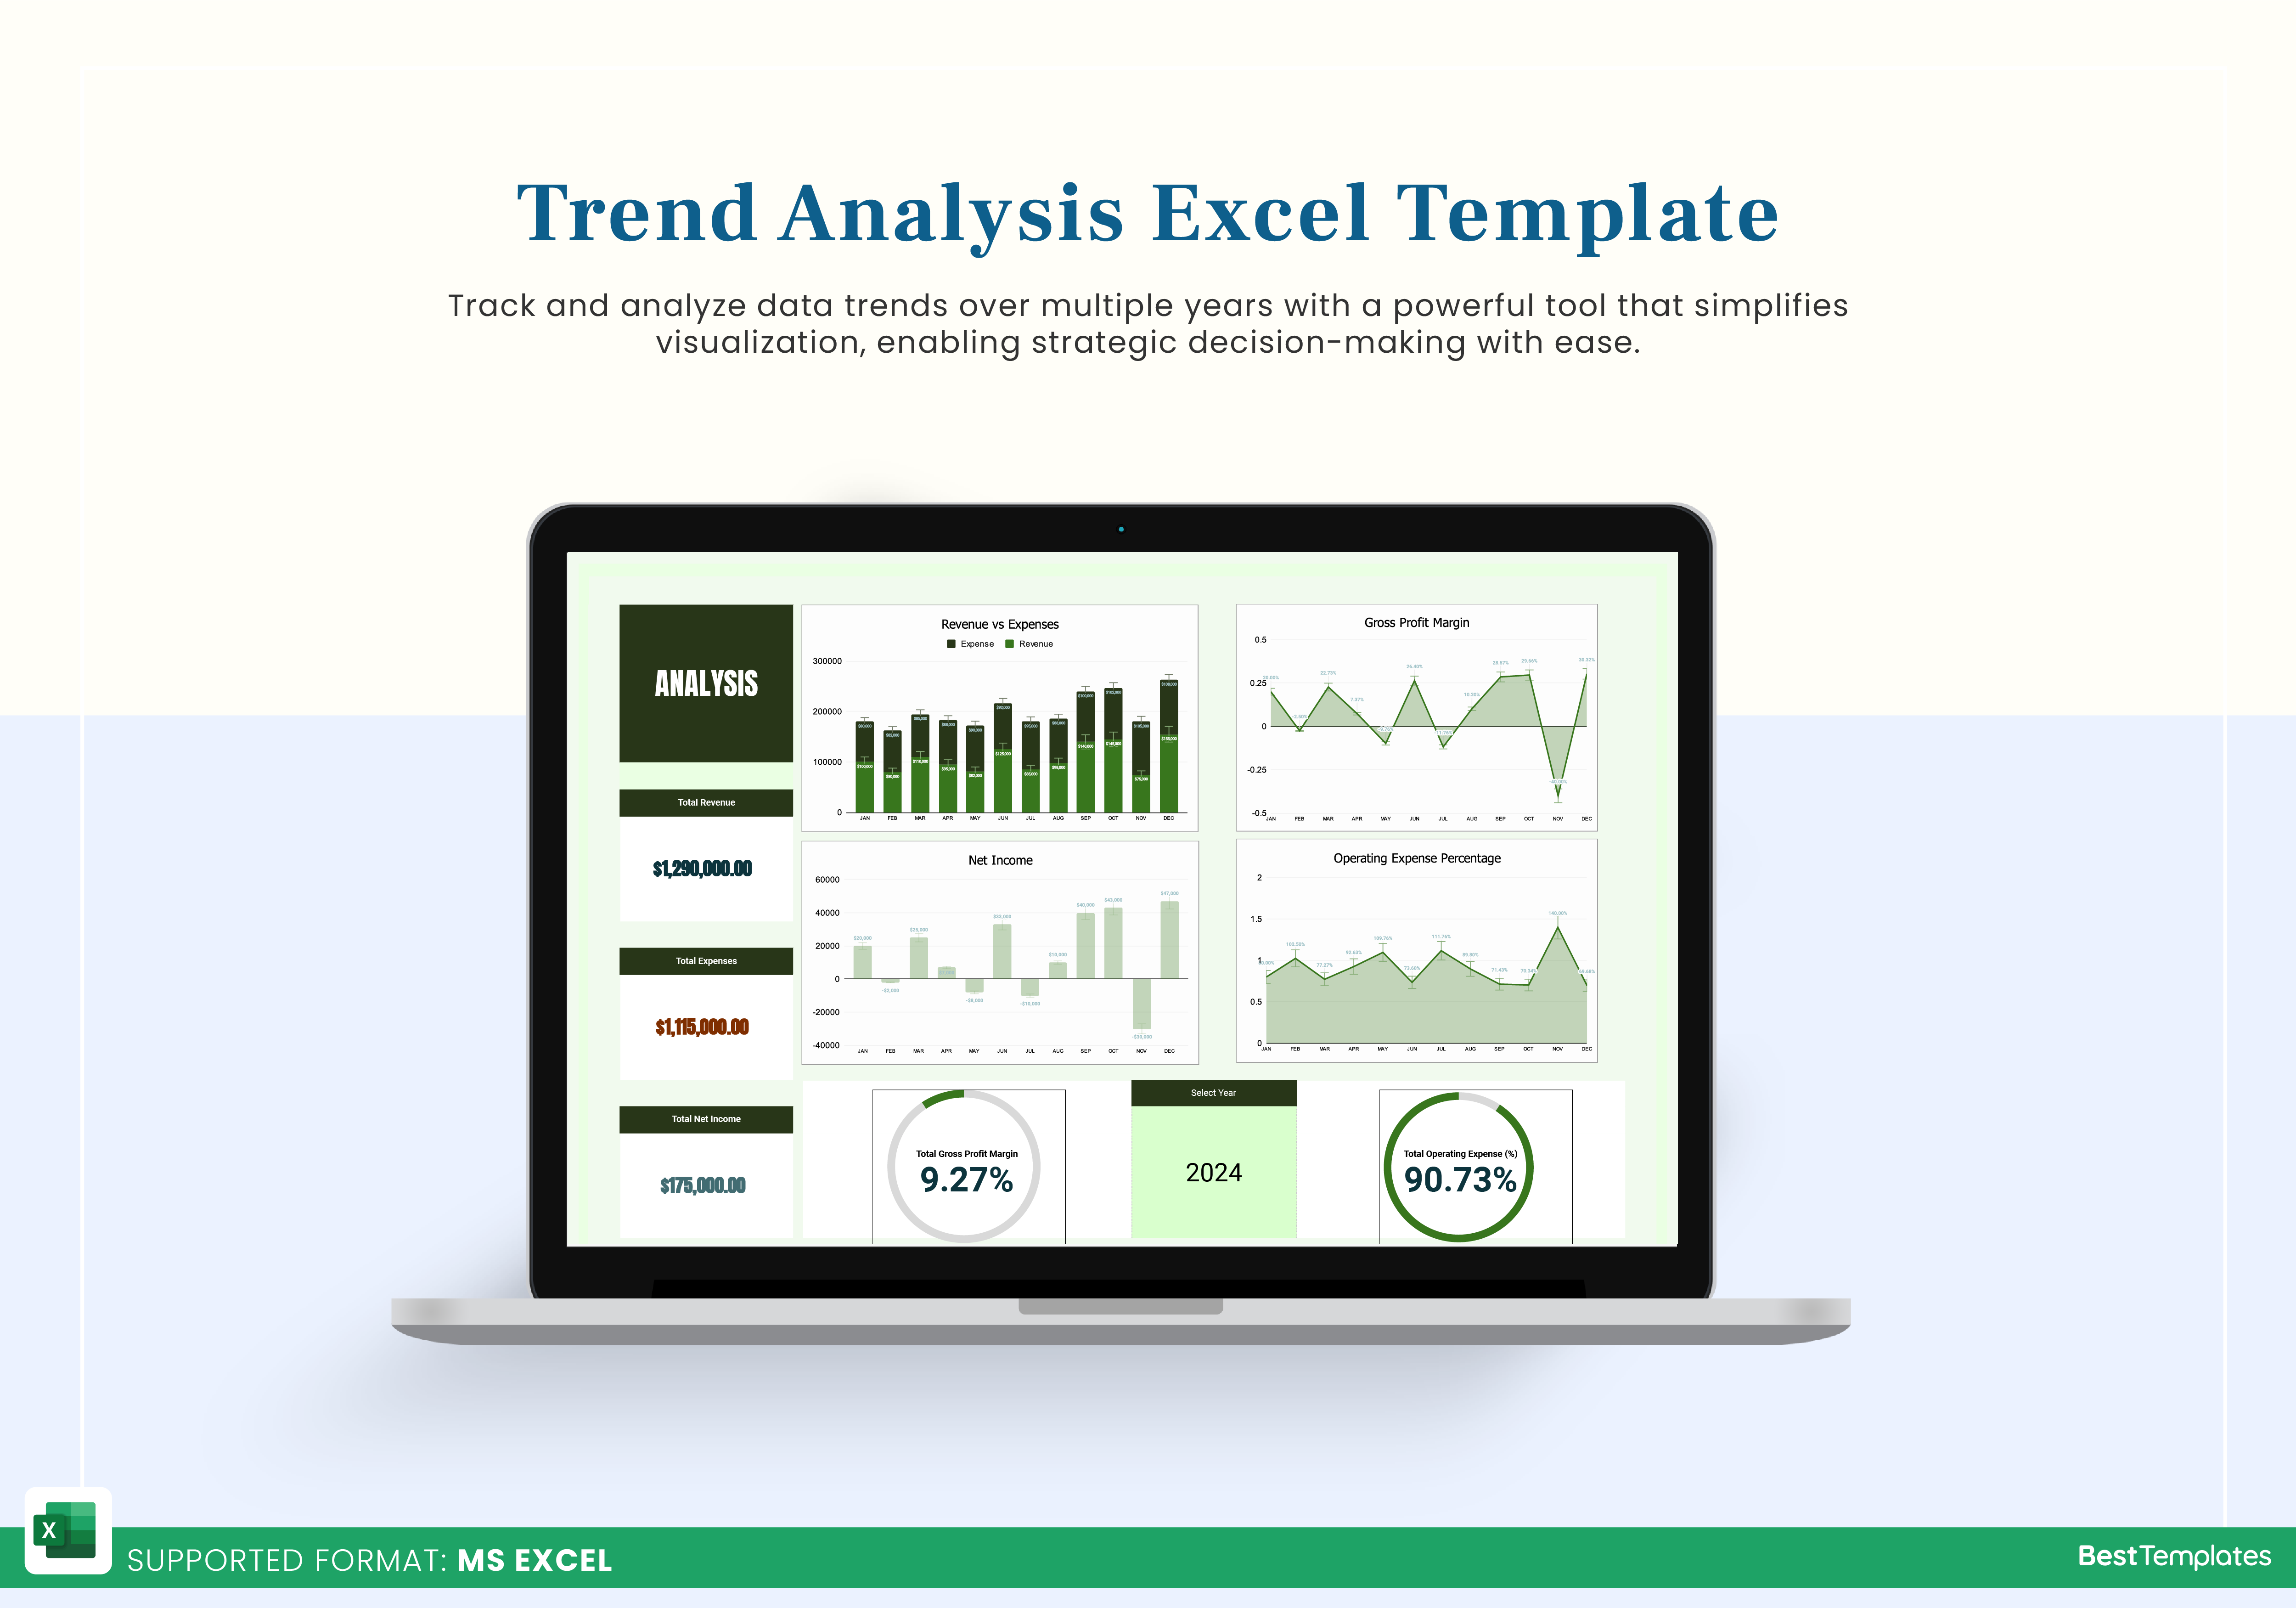
Understanding what the numbers mean is as critical as collecting them. Here are advanced techniques to read the trend data effectively.
Seasonality Analysis
Use moving averages to smooth out daily noise and reveal seasonal patterns. For instance, a spike in slip incidents during the winter months may indicate inadequate de‑icing protocols.
Severity Distribution
Plot the distribution of severity scores on a histogram. A heavy right‑skewed distribution signals that severe incidents are outliers that require targeted interventions.
Root Cause Correlation
Apply correlation matrices to determine whether certain root causes frequently co‑occur. For example, if “Improper PPE” correlates with “Chemical Spill,” enforce stricter PPE checks before chemical handling.
Benchmarking
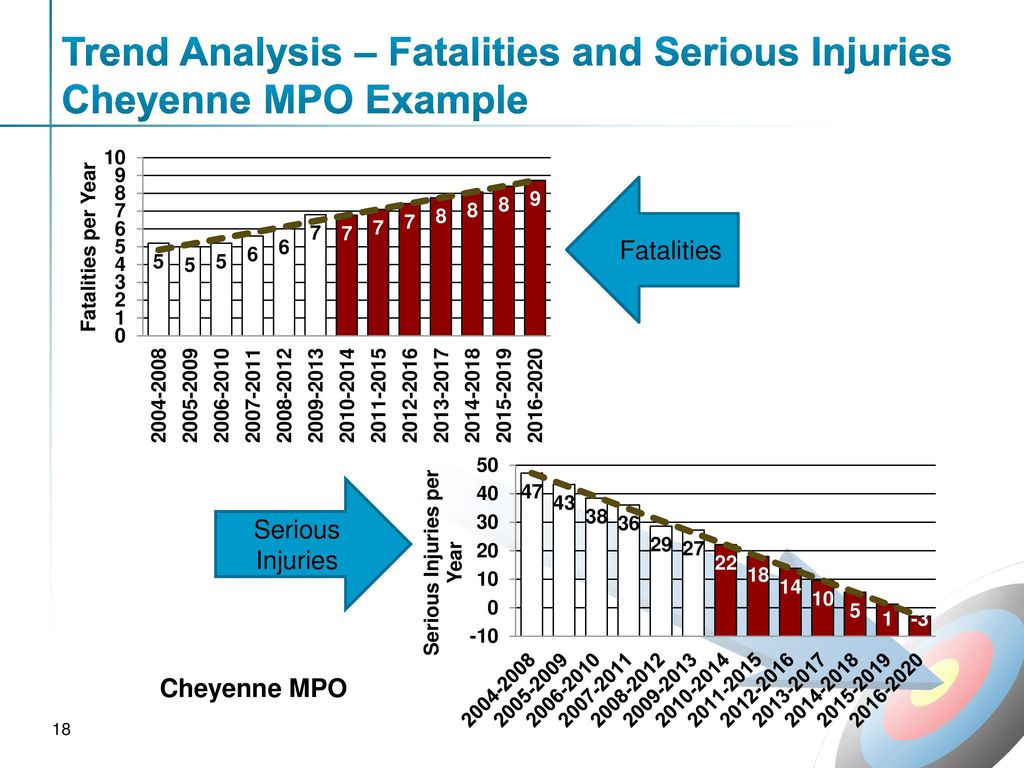
Compare your organization’s trend lines against industry averages or competitors’ data (when available). A lower trend slope indicates successful safety initiatives, whereas a steeper slope warrants a review of controls.
Integrating the Template into Your Safety Management System
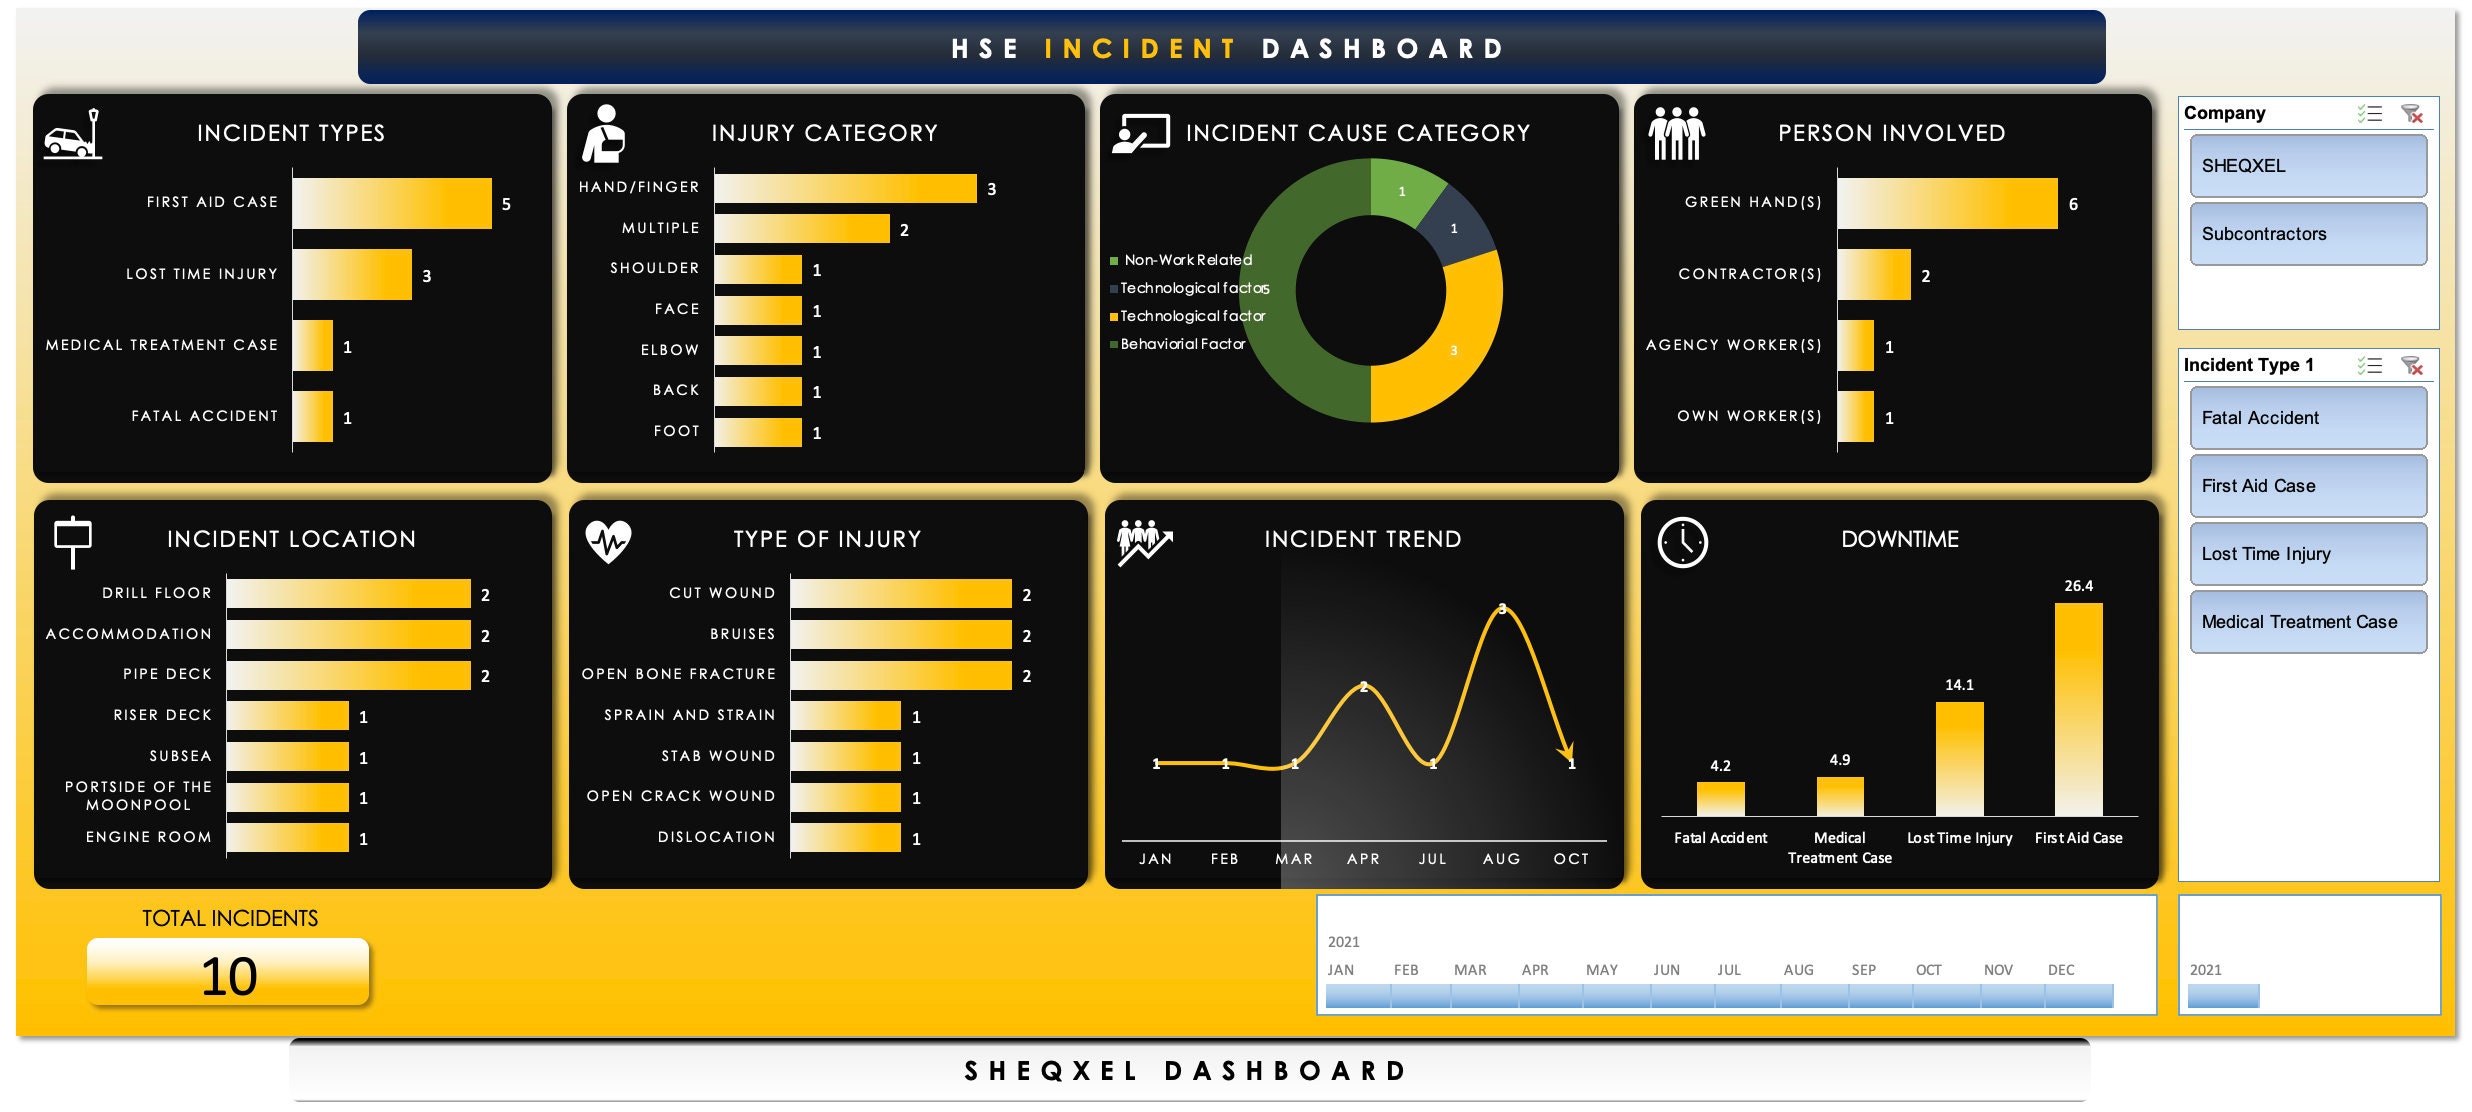
For maximum impact, the template should be a component of a broader safety ecosystem. Here’s how to weave it into existing processes.
Link to Incident Management Software
Use Excel’s Power Query to pull data from incident management platforms like iAuditor or SAP. Automate updates so that every new incident is reflected in real time.
Embed into Safety Reports
Export charts directly into PowerPoint or Word templates used for executive briefings. Include a “Trend Summary” slide that highlights key takeaways.
Integrate with KPI Dashboards
Connect the template’s output to enterprise KPI dashboards such as Power BI. Set up alerts that trigger when incident frequency exceeds a predetermined threshold.
Use in Safety Training
Leverage trend data to create case studies for training sessions. Show trainees how data trends translate into real‑world risks and how their actions can alter the curve.
Case Studies: Real‑World Success Stories
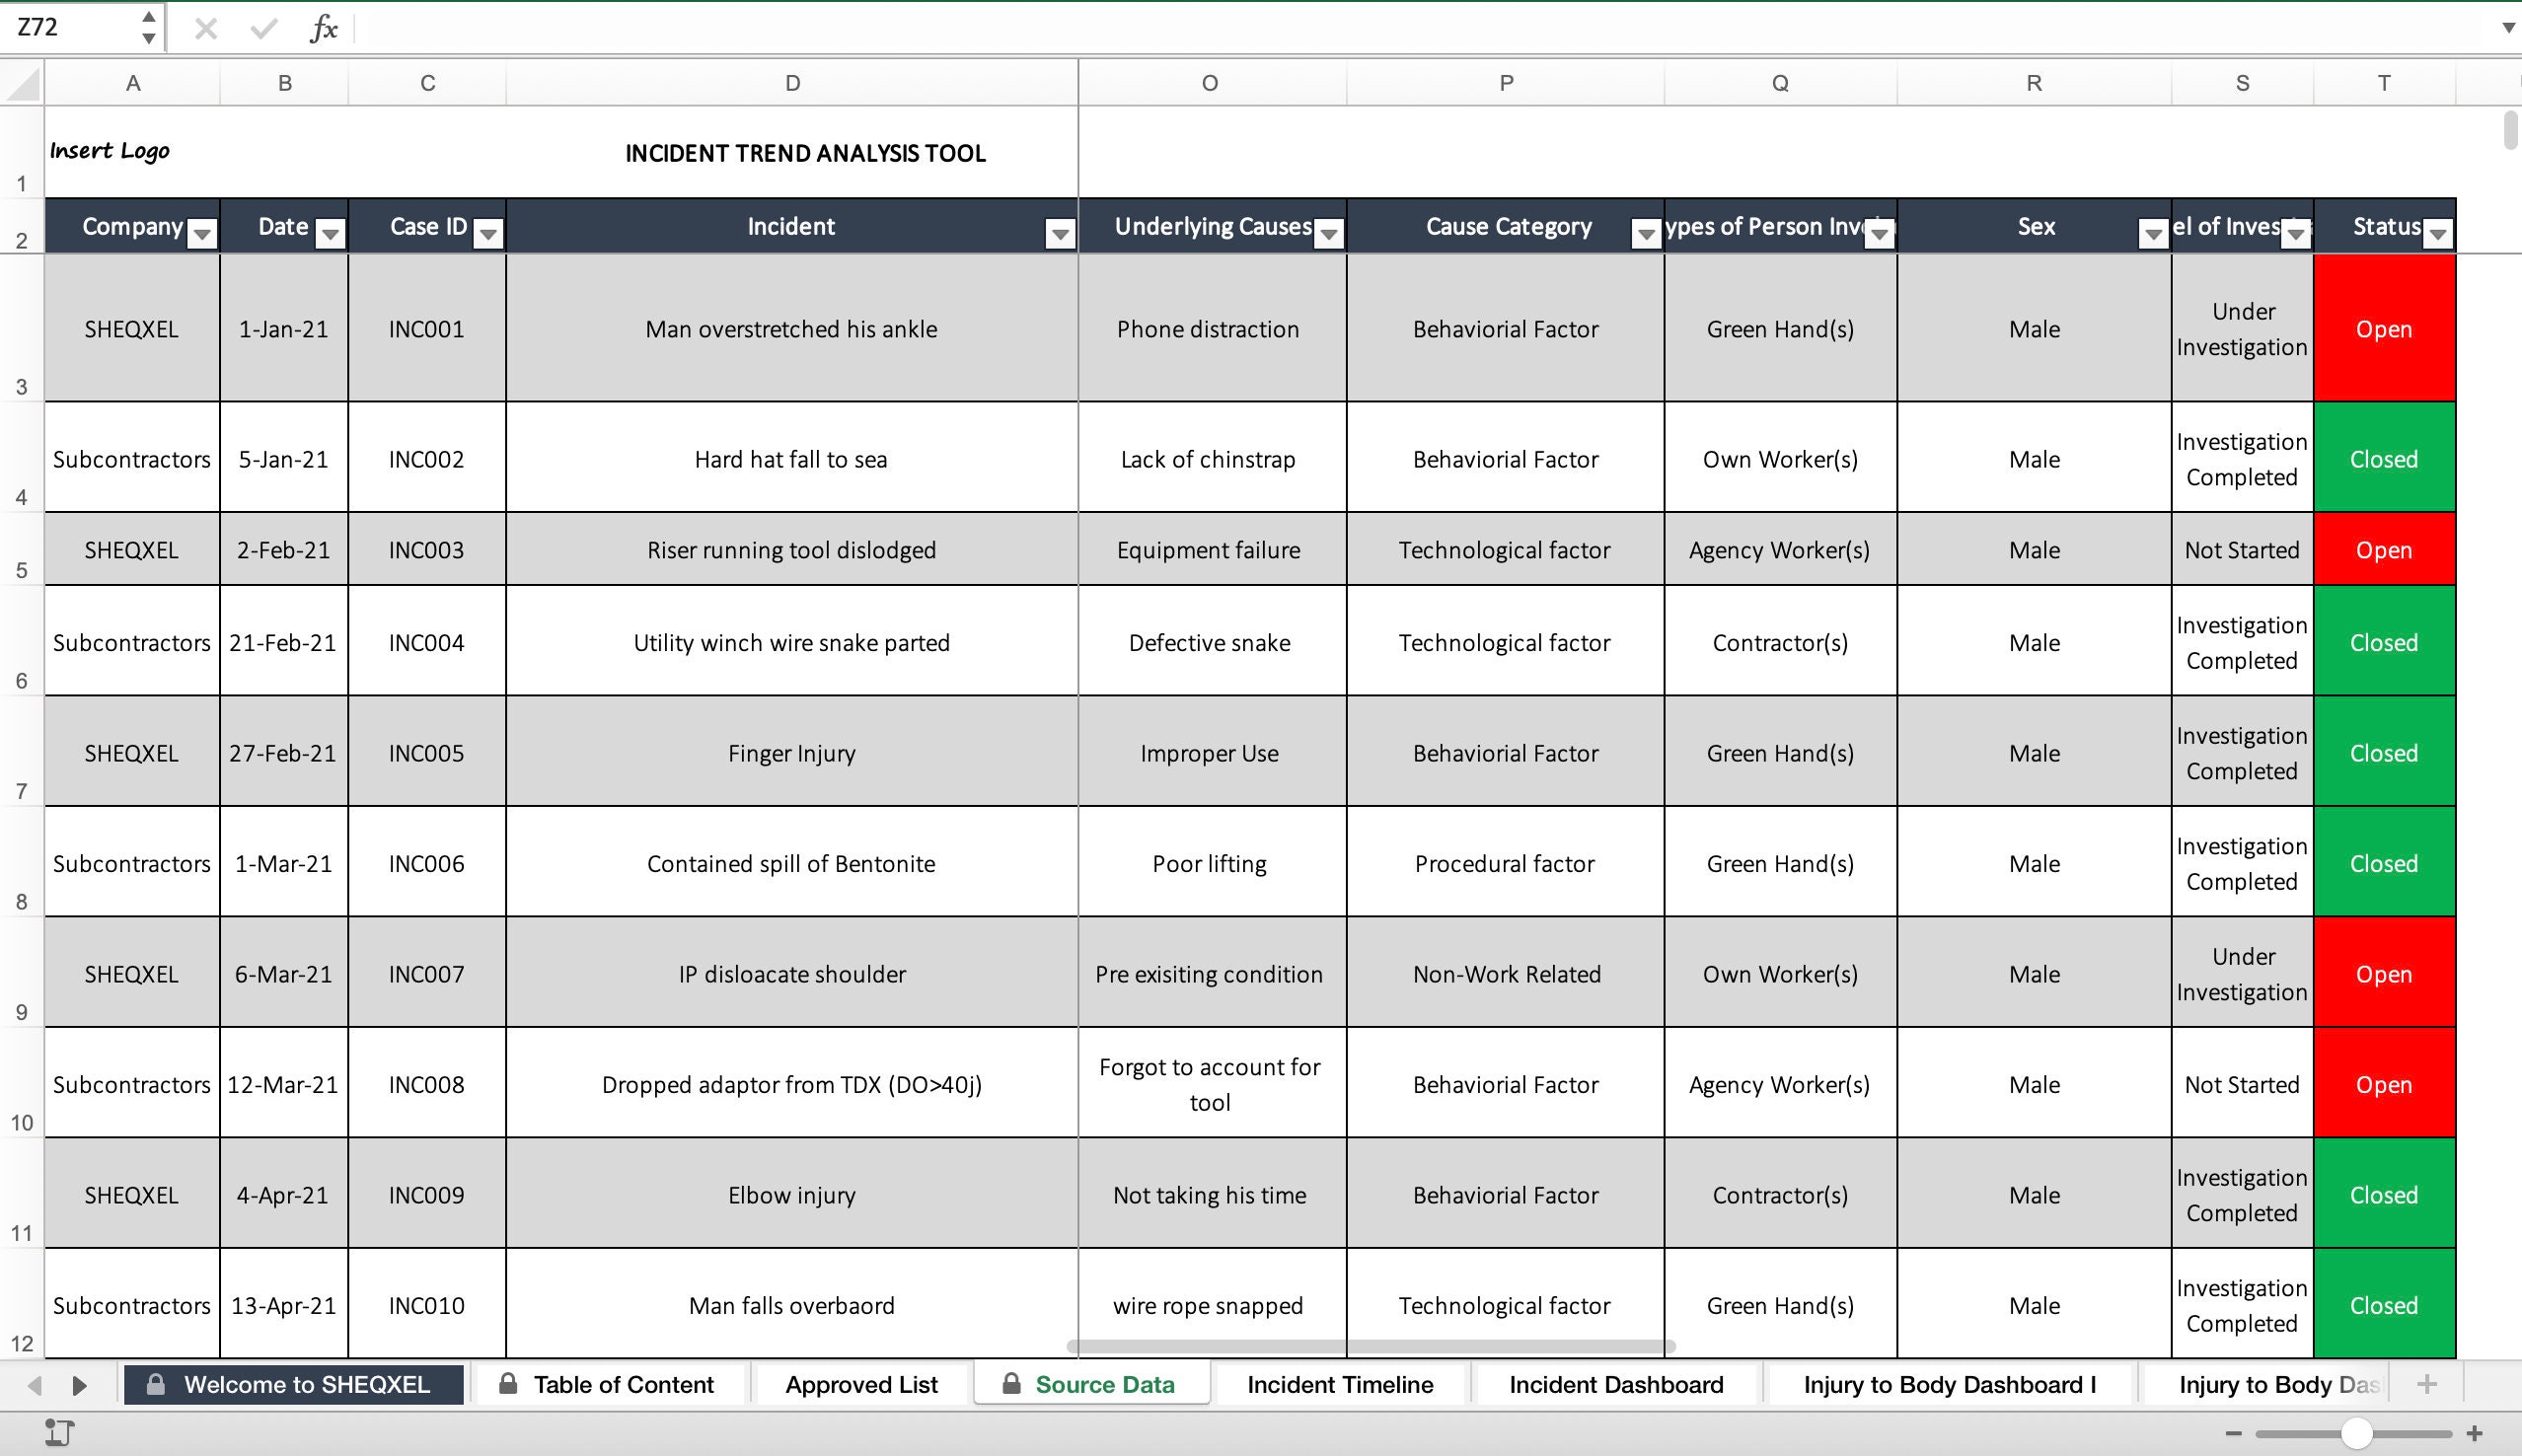
Seeing proven results can inspire adoption. Below are concise case studies from different sectors.
Case Study 1 – Manufacturing Plant
After implementing the template, a mid‑size metal fabrication plant reduced its incident frequency by 28% in 12 months. The plant introduced a weekly “Root Cause Review” meeting that leveraged the heatmap to prioritize corrective actions.
Case Study 2 – Construction Firm
Using the template’s custom “Permit Expiry” field, a construction company cut the number of fall incidents by 35%. Real‑time alerts were set up so that supervisors received notifications when a permit was close to expiration.
Case Study 3 – Healthcare Clinic
By adding a “Medication Error” flag, a clinic identified a 15% increase in prescription mistakes during night shifts. The clinic implemented a double‑check system, reducing medication errors to near zero within six months.
Common Pitfalls and How to Avoid Them
Even with a robust template, users can stumble if best practices are ignored. Address these common missteps early.
1. Skipping Data Validation
Without strict dropdowns and mandatory fields, data quality suffers. Always enable all validation checks before the template goes live.
2. Ignoring Historical Data
New users often focus only on recent incidents. Include a “Historical Data Import” step to bring in legacy records for comprehensive trend analysis.
3. Overcomplicating the Dashboard
Too many charts can overwhelm stakeholders. Keep the dashboard clean by limiting it to three key visualizations: frequency trend, severity distribution, and root cause heatmap.
4. Neglecting User Training
Employees must understand how to enter data correctly. Offer a concise training session and provide a one‑page cheat sheet.
5. Failing to Update Settings
Shift patterns, safety regulations, and company policies change. Schedule a quarterly review of the Settings tab to ensure all parameters reflect current realities.
Tips for Advanced Analytics
Once you’re comfortable with basic analysis, consider the following advanced techniques to deepen insights.
Time‑Series Forecasting with ARIMA
Export the incident frequency series to a statistical tool like R or Python, and fit an ARIMA model. Compare its forecasts to the template’s exponential smoothing to improve accuracy.
Regression Analysis for Risk Factors
Run a multivariate regression with incident severity as the dependent variable and factors such as shift, department, and PPE compliance as independent variables. This will quantify the impact of each factor.
Geospatial Mapping
If your organization has multiple sites, use Excel’s Map Chart feature to visualize incident hotspots. Layer the map with environmental data like wind speed or temperature for deeper context.
Monte Carlo Simulations
Simulate different safety intervention scenarios to estimate their potential impact on incident frequency. This probabilistic approach helps prioritize resource allocation.
Conclusion
Adopting a Safety Trend Analysis Excel Template transforms raw safety data into a powerful narrative that guides proactive decision‑making. By standardizing data collection, automating calculations, and visualizing trends, the template empowers safety leaders to identify risks early, allocate resources efficiently, and cultivate a culture of continuous improvement. Whether you’re a seasoned safety professional or a newcomer to data‑driven risk management, this template offers a practical, customizable, and scalable solution that fits seamlessly into any organization’s safety framework. Embrace the template, refine it to your industry, and watch as your safety performance moves from reactive to predictive—creating a safer, more resilient workplace for everyone.